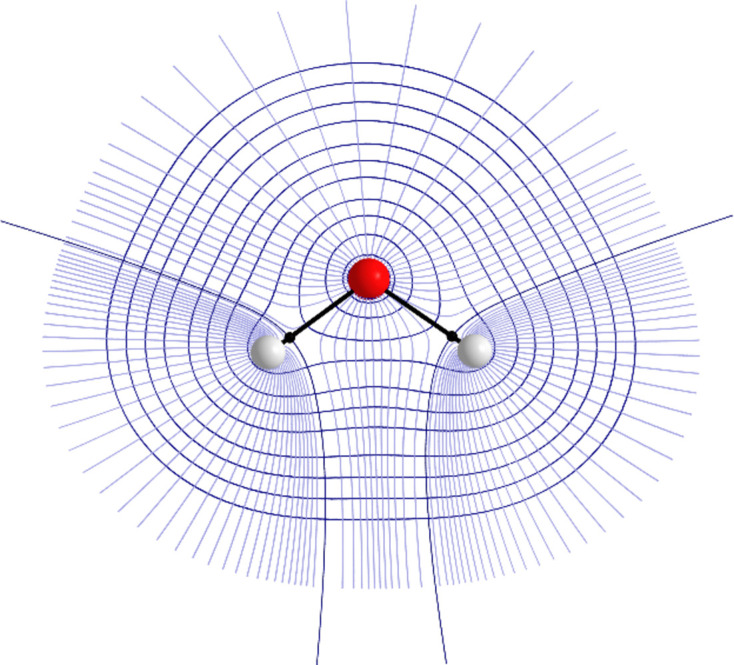
Figure 2.

Contour plot of the electron density of the water monomer partitioned using QTAIM. Gradient paths are shown in blue, black paths represent the interatomic surfaces and black spheres represent bond critical points. This figure was made using AIMStudio (Keith, 2019 ▸).
