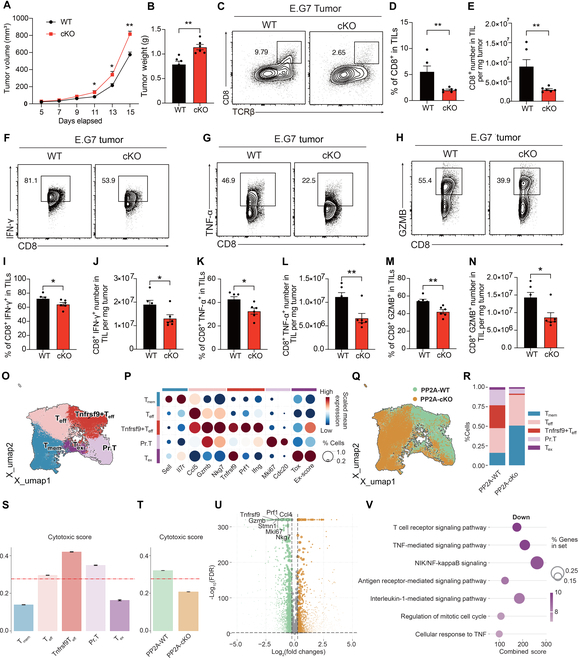
Fig. 3.

Specific deletion of PP2A in CD8+ T cells attenuates its antitumor properties. (A and B) WT and Ppp2cafl/fl/CD8acre mice (8 to 14 weeks old) were subcutaneously injected with 5 × 10⁵ E.G7 cancer cells and euthanized at 14 d later (n = 5). Tumor volume (A) and weight (B) were assessed on day 14 following engraftment, coinciding with the euthanasia of the mice (n = 6). (C to E) The phenotype of TILs (C) and the percentage (D) and cell number count (E) of CD8+ T cells among E.G7 TILs were assessed using flow cytometry (n = 6). (F to N) Representative flow cytometry plots and bar plots showing the percentage and total cell count of CD8+ IFN-γ+ T cells (F, I, and J), CD8+ TNFα+ T cells (G, K, and L), and CD8+ GZMB+ T cells (H, M, and N) within TILs (n = 6). (O to V) CD8+ TILs were isolated for scRNA-seq, and 5 clusters of CD8+ T cells were identified (O) and characterized by their signature genes (P). UMAP plot showing the difference between WT and cKO CD8+ T cells (Q). Proportions of different cell types (R). The cytotoxic score for the 5 CD8+ T cell subsets (S). The cytotoxic score between WT and cKO CD8+ T cells (T). Differentially expressed genes between WT and cKO CD8+ T cells by DEG analysis (U). GSEA network analysis of down-regulated pathways in PP2A cKO CD8+ TILs (V). Mean ± SEM; *P < 0.05, **P < 0.01, 2-tailed unpaired Student’s t test.
