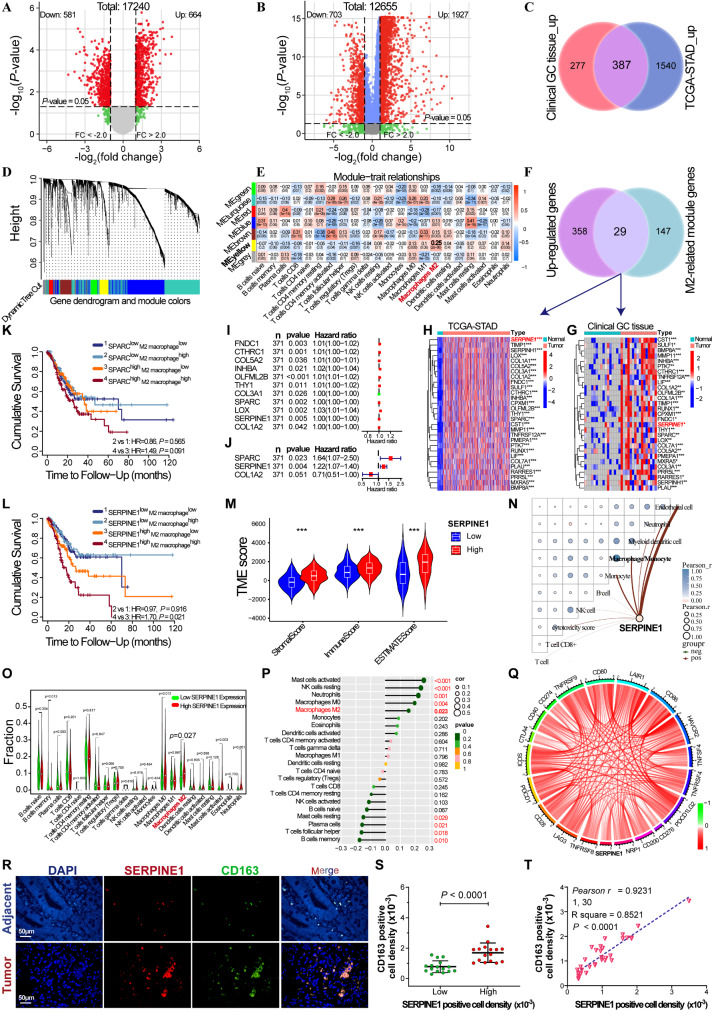
Fig. 1.
Screening of genes associated with M2 macrophages and prognosis of GC. Volcano plots of differential mRNA expression in 16 GC patients (A) and TCGA-STAD cohort (B); red dots indicate upregulated genes, and green dots indicate downregulated genes. (C) Venn diagram of upregulated mRNAs in 16 GC patients and the TCGA-STAD cohort. (D) WGCNA cluster dendrogram and module assignment using a dynamic tree-cutting algorithm. (E) Correlation between module genes and immune cell infiltration. The abscissa represents different types of immune cell infiltration and the ordinate represents different modules. Each rectangle displayed the Pearson correlation coefficient. (F) Venn diagram of the upregulated mRNAs and M2-related yellow module mRNAs. (G and H) Heatmap of M2-related module-mRNA expression in 16 GC patients and the TCGA-STAD cohort. (I and J) Forest plots of univariate and multivariate Cox regression analysis of the M2-related module mRNAs. Kaplan-Meier cumulative survival curves for the combined analysis of SPARC (K) or SERPINE1 (L) expression and M2 macrophage infiltration in GC. (M) Differential analysis of immune stromal components between high- and low-SERPINE1 expression groups. (N) Correlation analysis of SERPINE1 expression and immune cells. (O) Differential analysis of immune cell infiltration between high- and low-SERPINE1 expression groups. (P) Correlation analysis of SERPINE1 expression and immune cell infiltration. (Q) Correlation analysis of SERPINE1 expression with immune checkpoint expression. (R) Immunofluorescence analysis of CD163 and SERPINE1 expression in 32 pairs of GC and non-GC tissue. (S) Difference of CD163-positive cell density between high and low SERPINE1-positive cell density groups. (T) Correlation analysis of CD163-positive and SERPINE1-positive cell densities in 32 GC tissues

