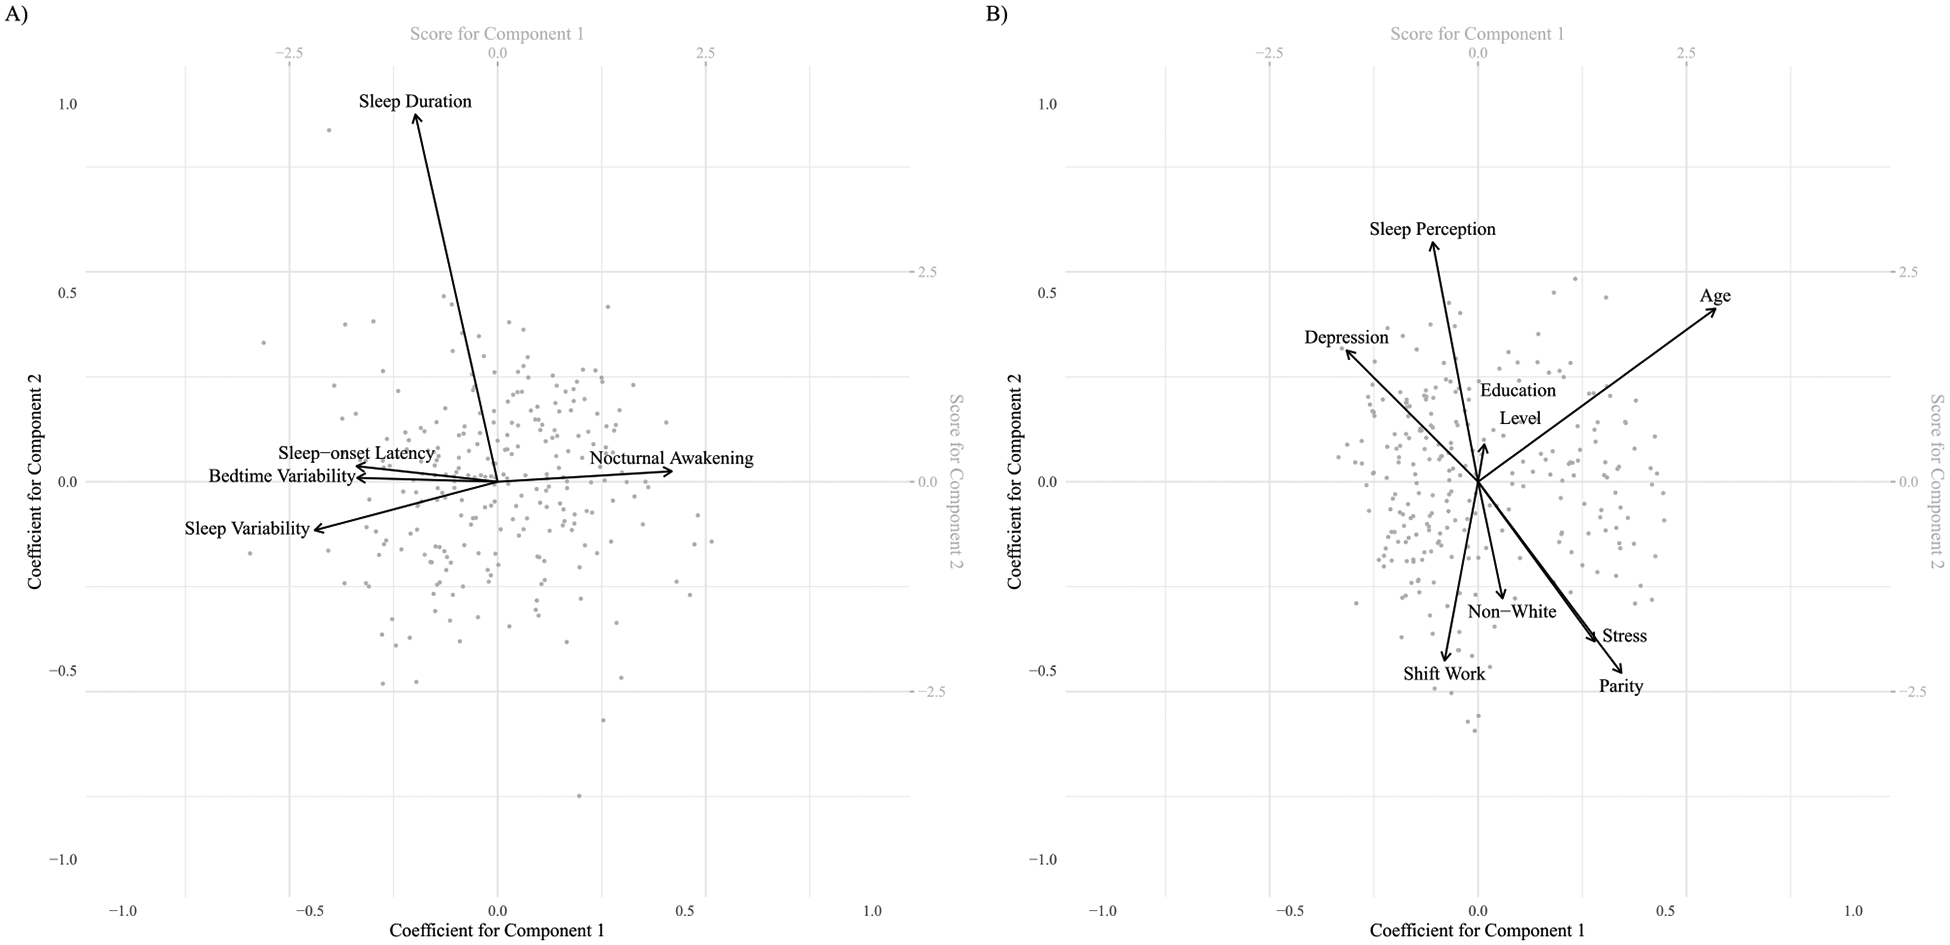
Fig. 2.

Biplot showing associations between sleep dimensions (2A) and their correlates (2B) based on canonical correlation analysis; arrows indicate variable loading for each component, points correspond to person-specific scores.

Biplot showing associations between sleep dimensions (2A) and their correlates (2B) based on canonical correlation analysis; arrows indicate variable loading for each component, points correspond to person-specific scores.