. 2025 Jan 2;15(1):199–206. doi: 10.1039/d4ra07209j

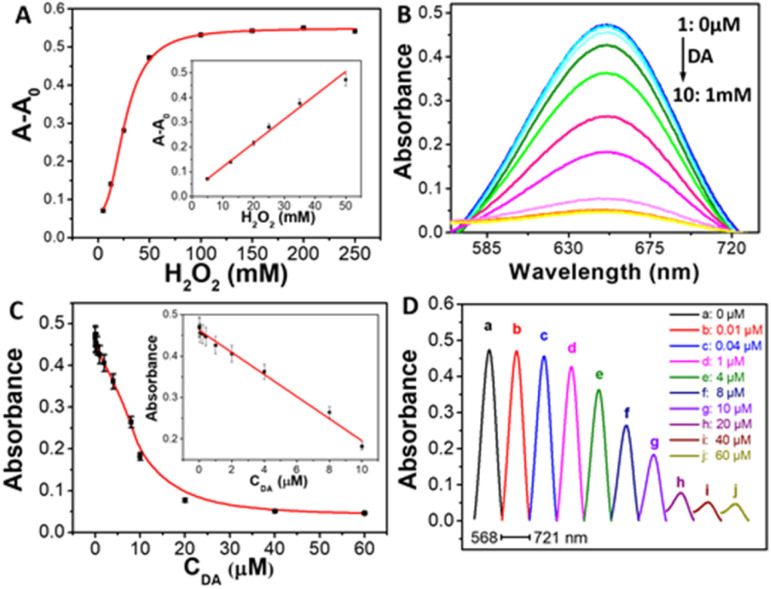
Fig. 4. (A) The curve of the absorbance intensity at 652 nm versus H2O2 concentration. Inset: the linear plot for H2O2 determination. (B) Absorption spectra of the TMB solution in the presence of various concentrations of DA by using BSA-Cu NPs as nanomaterial-based peroxidase mimics. (C) Plots of the absorbance intensity of TMB at 652 nm as a function of the concentration of the analyte DA. Inset: the linear calibration plot for DA detection. The error bars represent the standard deviation of three measurements. (D) Horizontal stacking diagram of UV-vis spectra of prepared BSA-Cu NPs incubated with different concentrations of target DA. Conditions: 1, (a), BSA-Cu NPs; 2–10 (b–j): 1 + DA (μM): 0.01, 0.04, 1, 4, 8, 10, 20, 40, and 60 μM, respectively.

Fig. 4