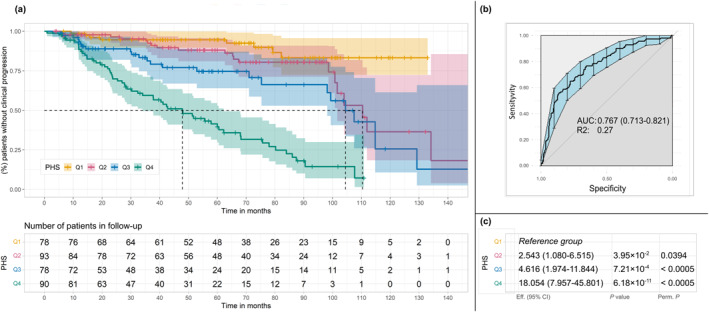
FIGURE 2.

Results of PHS analyses. The PHS was calculated by summing the number of effect alleles and was divided into quartiles based on the distribution of the score calculated in a reference population (1000 Genome Project; International Genome Sample Resource). In the first group (Q1) are patients with a lower number of effect alleles and, in each rank, are those with an increased number of effect alleles. (A) Kaplan–Meier curves of PHS. The table below the Kaplan–Meier curves represents the number of patients who were still undergoing follow‐up who had not yet manifested clinical progression. (B) The AUC of PHS analyses. (C) Results of the analyses adjusted by sex and age to evaluate the PHS, comparing each quartile with the first quartile. AUC indicates area under the receiver operating characteristic curve; CI, confidence interval; PHS, polygenic hazard score; Q, quartile; R2, Nagelkerke R‐squared (coefficient of determination) value; rs, reference single‐nucleotide polymorphism. Eff. (effect) refers to the hazard ratios derived from the Cox model for each quartile relative to Q1. P.perm: p‐value calculated using permutation testing, based on one million random permutations of the dataset to assess the significance of the observed results under the null hypothesis.
