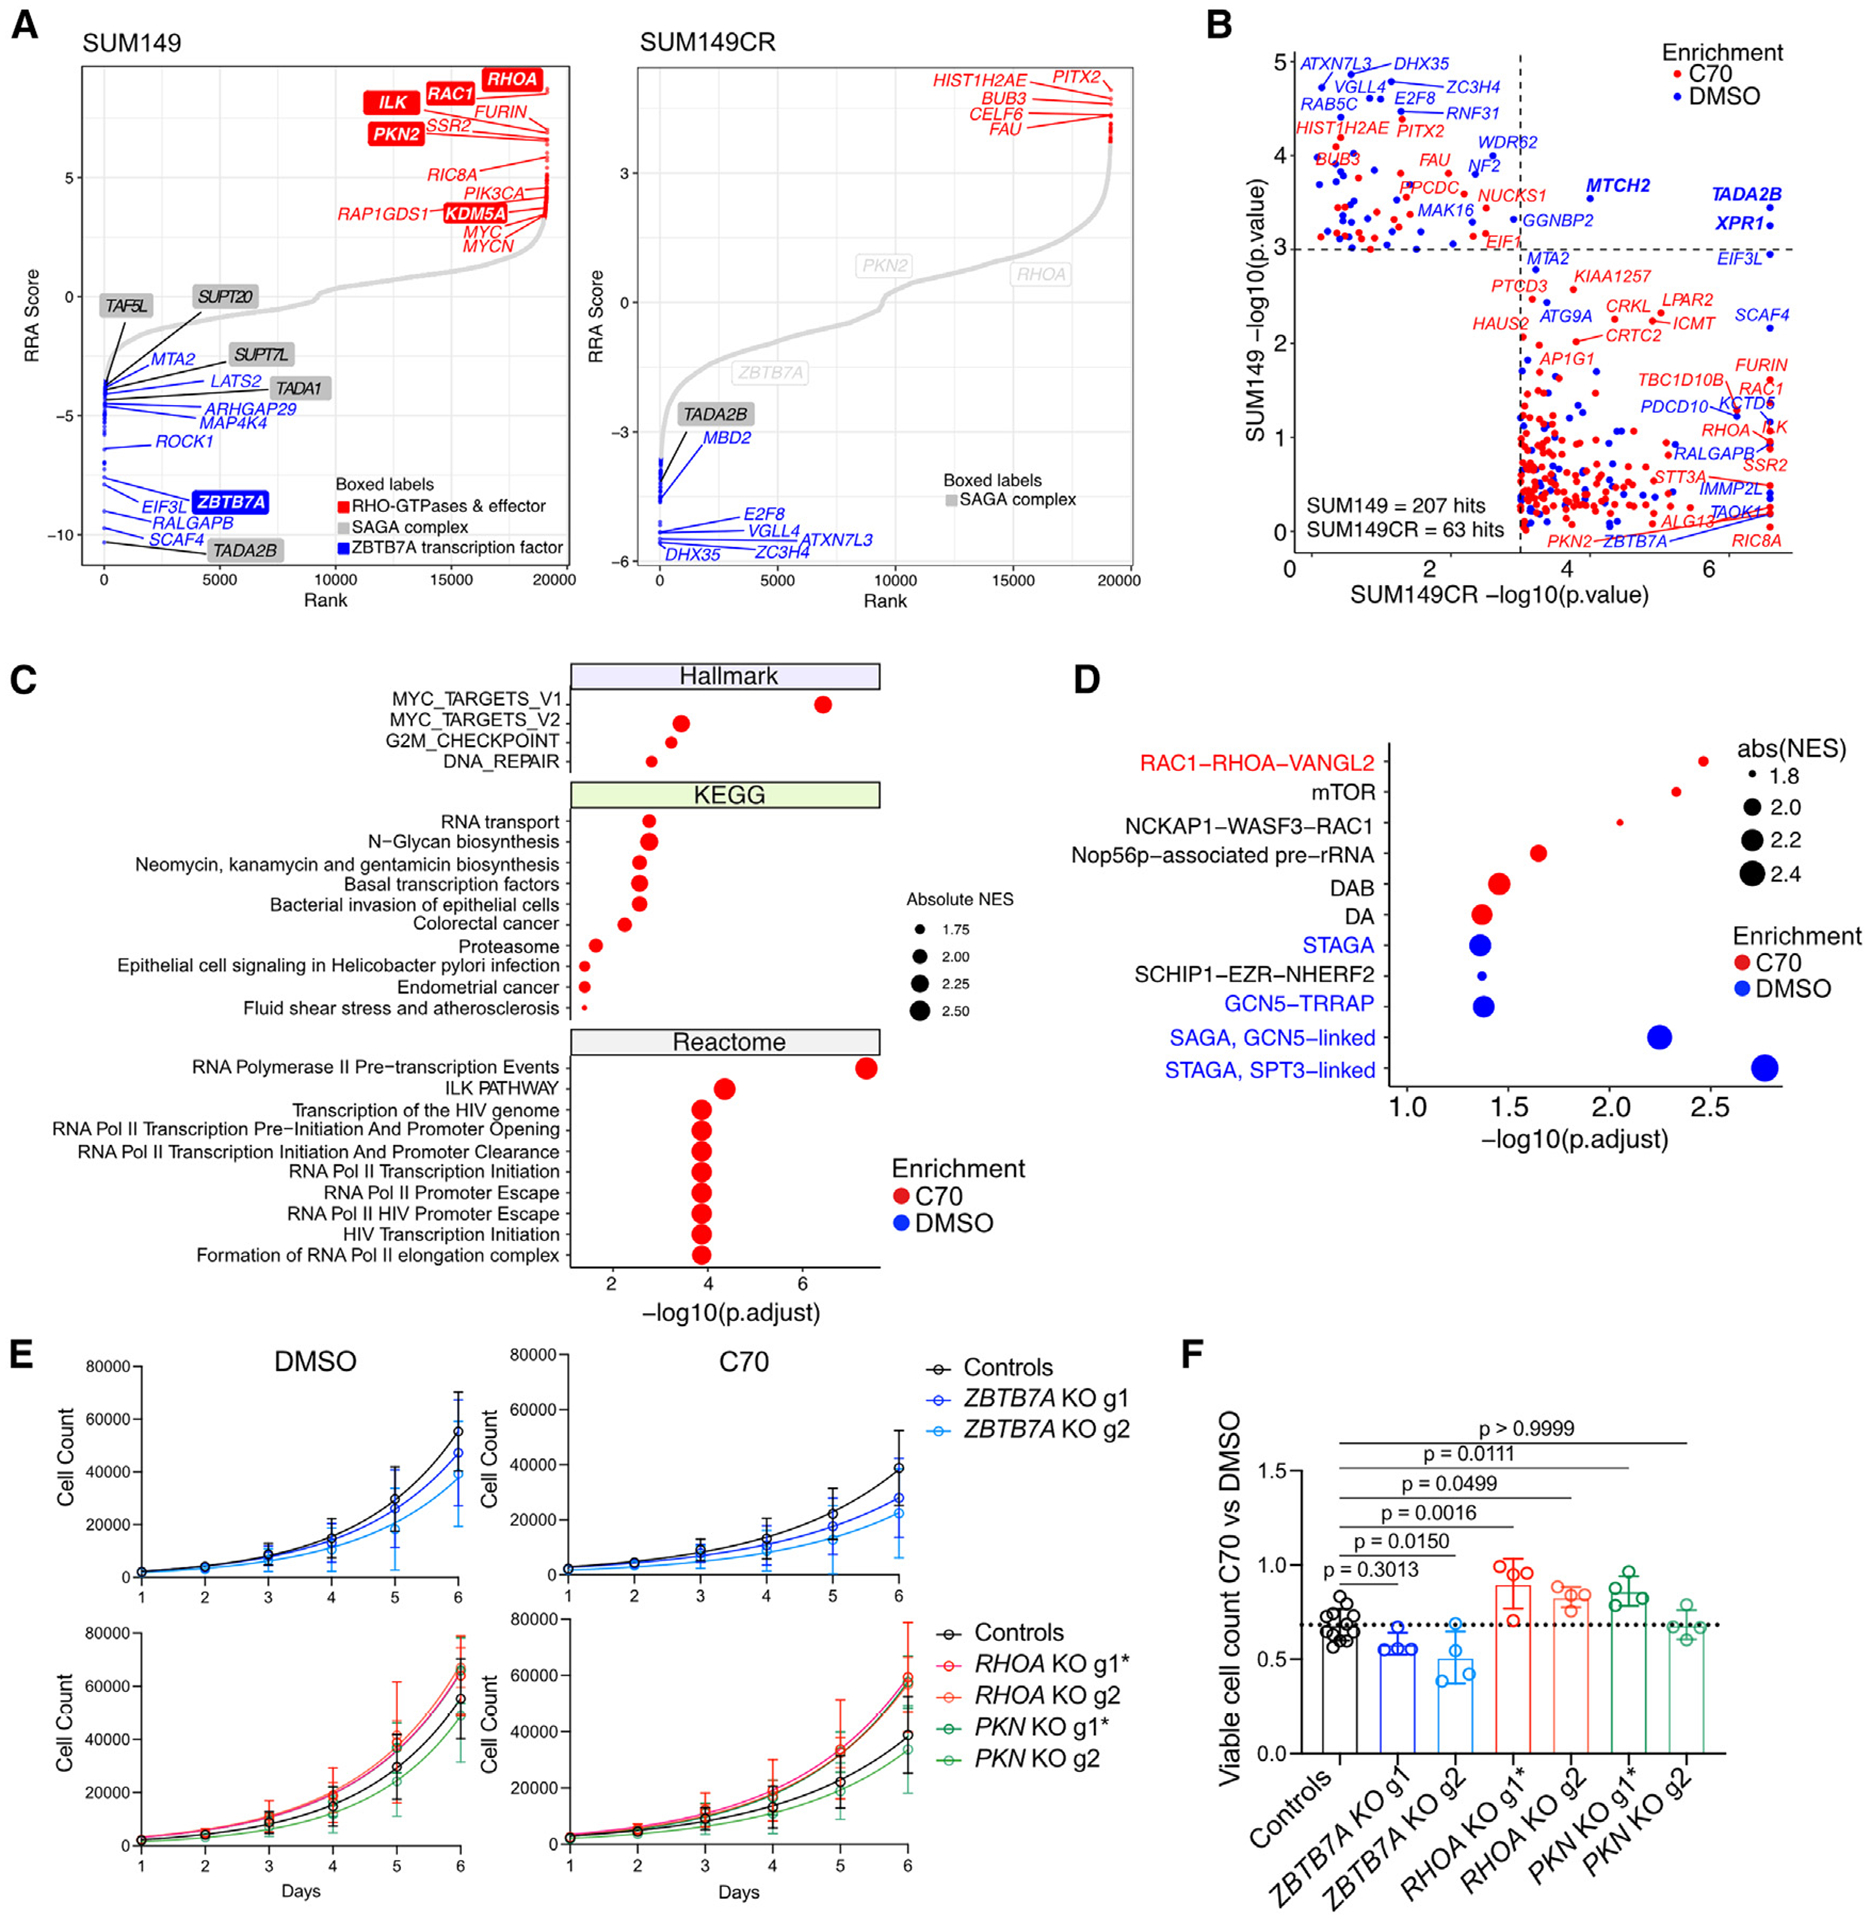
Figure 2. CRISPR screen results and validation.

(A) Rank plots of CRISPR KO viability screens in SUM149 and SUM149CR cells after 10 doublings ± 10 μM C70. Genes are ranked based on the computed RRA score from MaGECK RRA, which indicates the essentiality of each gene. Positive RRA scores indicate enriched in C70. Negative RRA scores indicate enriched in DMSO. Differentially enriched hits (p < 0.001) are marked in blue and red for DMSO-enriched and C70-enriched hits, respectively.
(B) Comparison of CRISPR hits with p < 0.001 in either the SUM149 or the SUM149CR CRISPR screens ± C70.
(C and D) GSEA on RRA-ranked CRISPR screen results in SUM149. Top 10 most significant gene sets with padj < 0.05 from the indicated databases (C) and CORUM protein complexes (D) are shown.
(E) Cell growth assays of SUM149 cells expressing constitutive Cas9 and guide RNAs (gRNAs) targeting ZBTB7A, RHOA, PKN2, or non-targeting controls. gRNAs with more efficient KO efficiency are marked with an asterisk (see also Figure S2L). Data are the mean ± standard deviation (n = 4, controls are merged ROSA26 and NonTargeting cells with n = 4 each).
(F) Bar plot depicting quantification of ratios in viable cell numbers upon DMSO vs. C70 treatment at day 6. Data are the mean ± standard deviation, one-way ANOVA followed by Dunnett’s multiple comparisons test comparing to control group only (n = 4, controls are merged ROSA26 and cells expressing non-targeting gRNAs with n = 4 each).
See also Figure S2.
