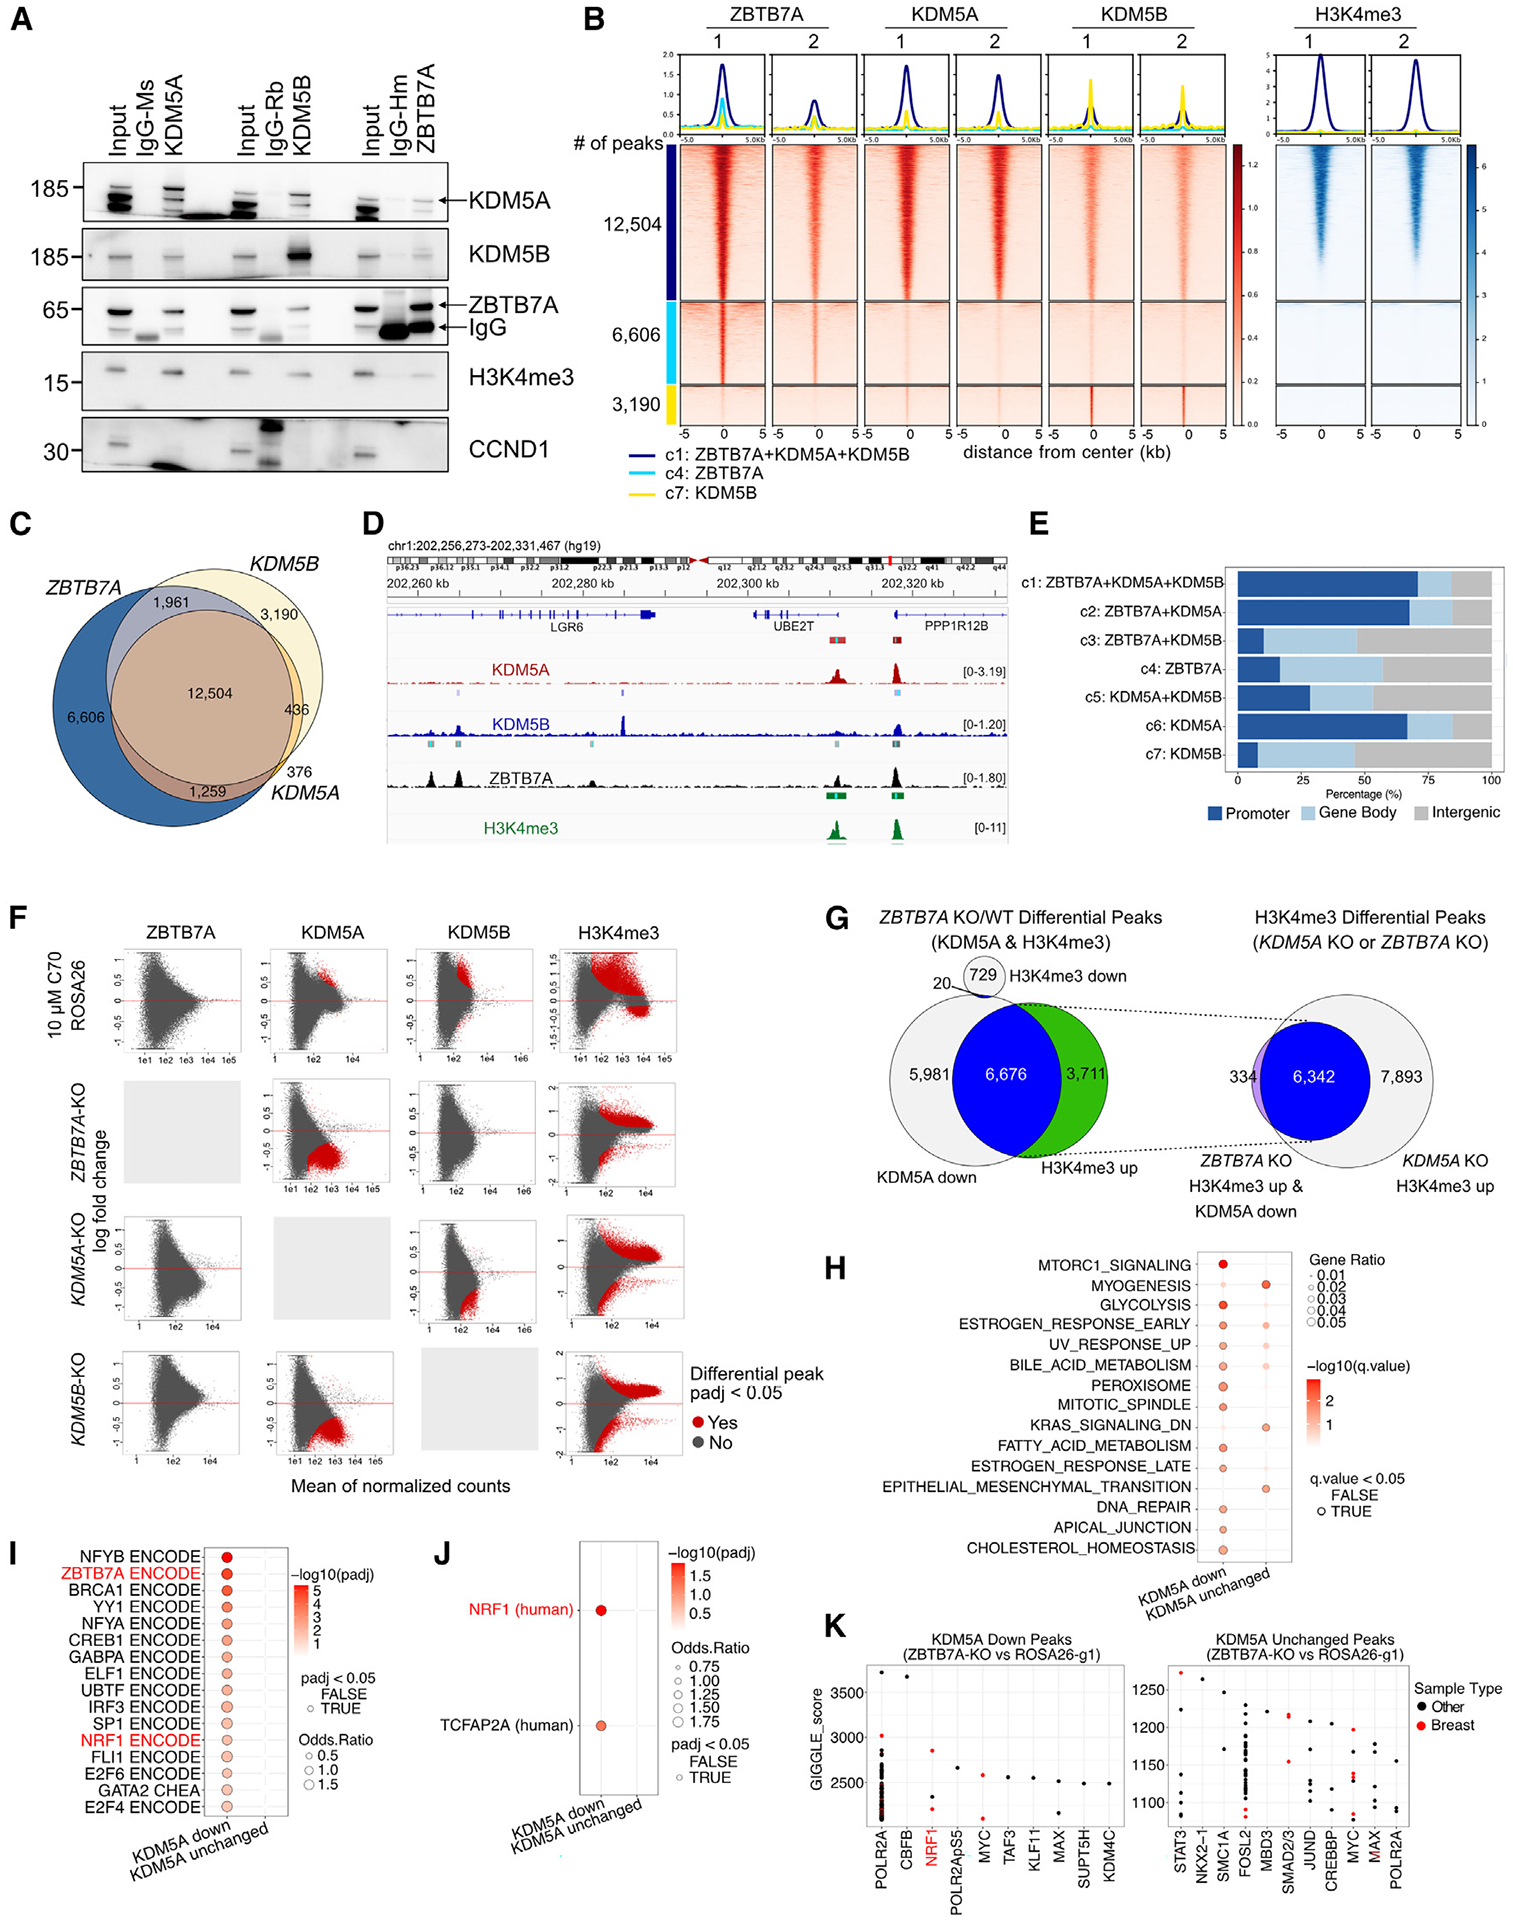
Figure 3. ZBTB7A and KDM5A/B interact and co-localize on DNA with high H3K4me3 levels.

(A) Immunoblot analysis of ZBTB7A, KDM5A, and KDM5B in total cell lysates (input), control IgG, and the indicated immunoprecipitants in SUM149 cells.
(B) Heatmap of ChIP-seq for ZBTB7A, KDM5A, KDM5B, and H3K4me3. Peaks are clustered based on the intersection of peak calls among the three proteins.
(C) Venn diagram illustrating overlap of ChIP-seq peaks.
(D) Example ChIP-seq bigwig tracks with the hg19 genome as a reference.
(E) Genomic feature distribution of peaks within clusters.
(F) MA plots showing differential peak enrichment for the indicated proteins (columns) after the indicated perturbations (rows). Each perturbation is compared to SUM149-ROSA26-g1 in DMSO. Differential peaks are indicated in red (padj < 0.05; default output from CoBRA (Containerized Bioinformatics Workflow for Reproducible ChIP/ATAC-seq Analysis) using the Wald test from DEseq2). The y axis shows log fold change; x axis shows mean of normalized counts.
(G) Venn diagrams showing overlap between KDM5A down and H3K4me3 up peaks in ZBTB7A KO cells. The intersect of these peaks is then compared with H3K4me3 up peaks in KDM5A KO cells.
(H–J) Overlap of the top 500 predicted target genes of KDM5A down/unchanged peaks in the ZBTB7A KO with the described gene sets. (H) Hallmark pathways, (I) consensus target genes for transcription factors present in ENCODE and ChEA, (J) position weight matrices from TRANSFAC and JASPAR at the gene promoters. The top 500 target genes were identified via the regulatory potential score from BETA.32
(K) Overlap of the entire set of KDM5A down/unchanged peaks in the ZBTB7A KO with public ChIP-seq tracks available on CISTROME.33 The top 10–11 enriched transcription factors are shown ranked by GIGGLE score (−log10(p) * odds ratio).34
See also Figure S3.
