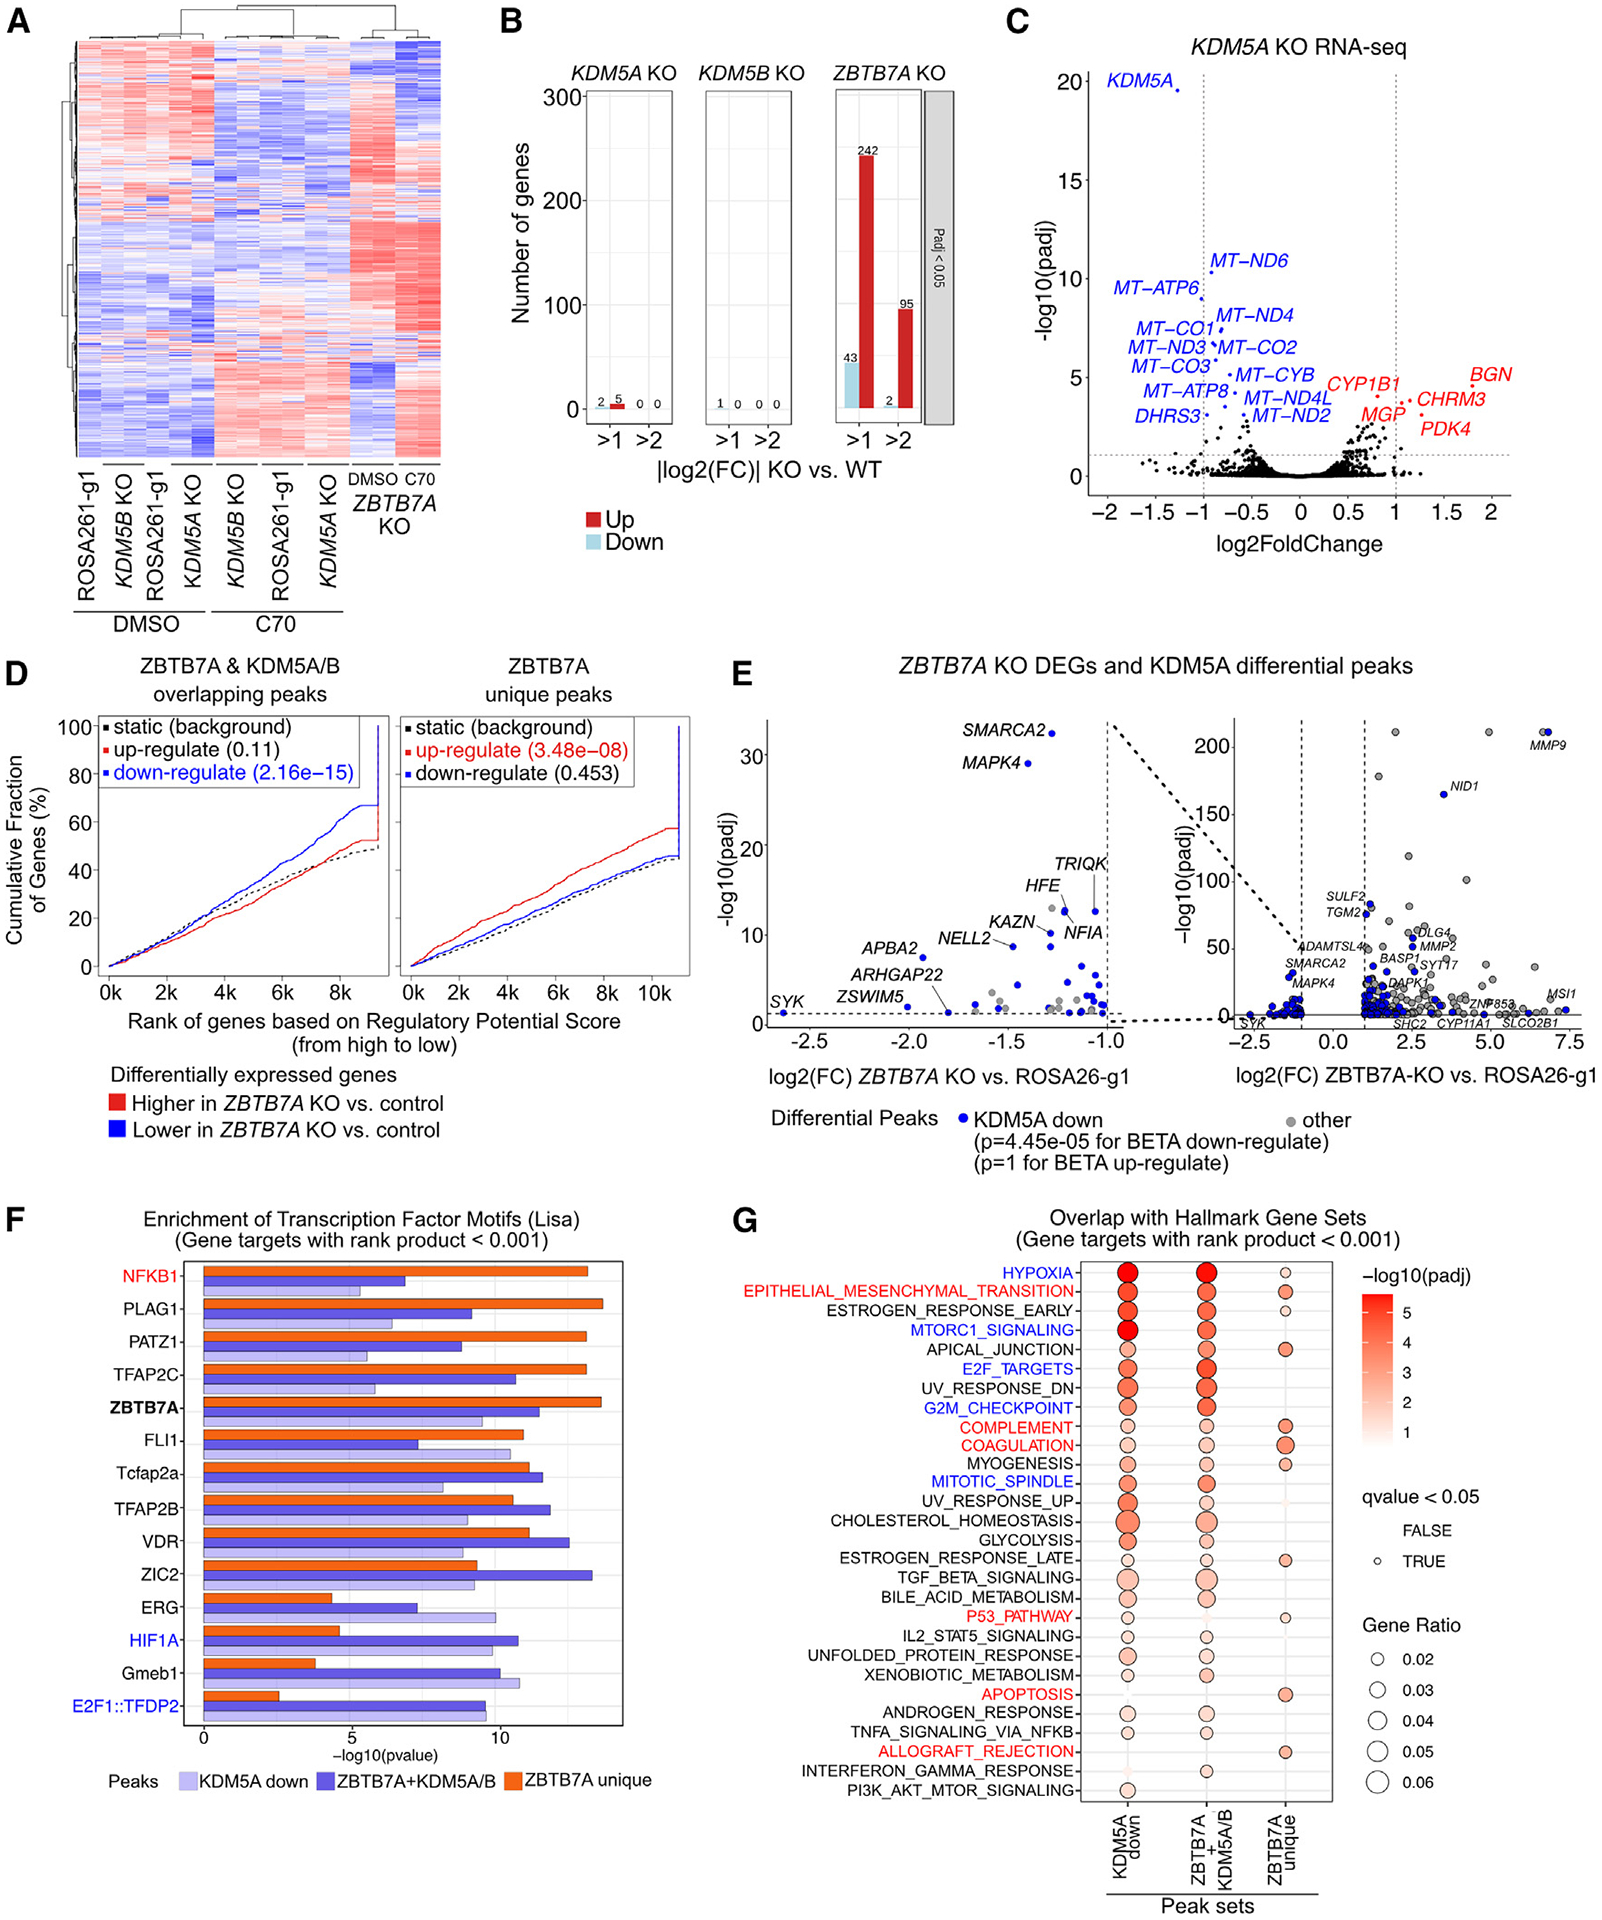
Figure 4. Gene expression changes induced by ZBTB7A-KO and its associations with ZBTB7A and KDM5A/B peak sets.

(A) Heatmap of RNA-seq in SUM149 cells expressing the indicated gRNAs treated with DMSO or 10 μM C70 for 7 days. Rows and columns are ordered based on hierarchical clustering. Values are row-normalized Z scores.
(B) Number of DEGs for KOs in SUM149 cells compared to the ROSA26-g1 control.
(C) Volcano plot of RNA-seq in the SUM149 KDM5A KO compared to the ROSA26-g1 control. Dashed gray lines indicate adjusted p value (padj) and fold change (FC) cutoff used for (B).
(D) Output from BETA testing for association between the indicated peak sets and the up-/downregulated genes upon ZBTB7A KO.32 For promoter-enriched peaks, the distance from the transcription start site (TSS) for within which peaks were considered to contribute to the gene regulatory potential score was set to 3 kb. For non-promoter-enriched peak sets, the default parameter of 100 kb was used.
(E) Volcano plot comparing DEGs and decreased KDM5A peak enrichment in the ZBTB7A KO cells. Only significant DEGs are shown (padj < 0.05 and |log2(FC)| > 1). The p values are based on BETA, indicating if the differential peak set is significantly associated with up- or downregulated genes. Nearest genes to each peak are annotated.
(F and G) Overlap of the predicted target genes for each peak set with (F) CISTROME LISA transcription factor motifs (top 5 motifs per cluster are shown) and (G) Hallmark gene sets. Genes with a rank product score <0.001 from the BETA output were used as predicted target genes for each peak set.
See also Figure S4.
