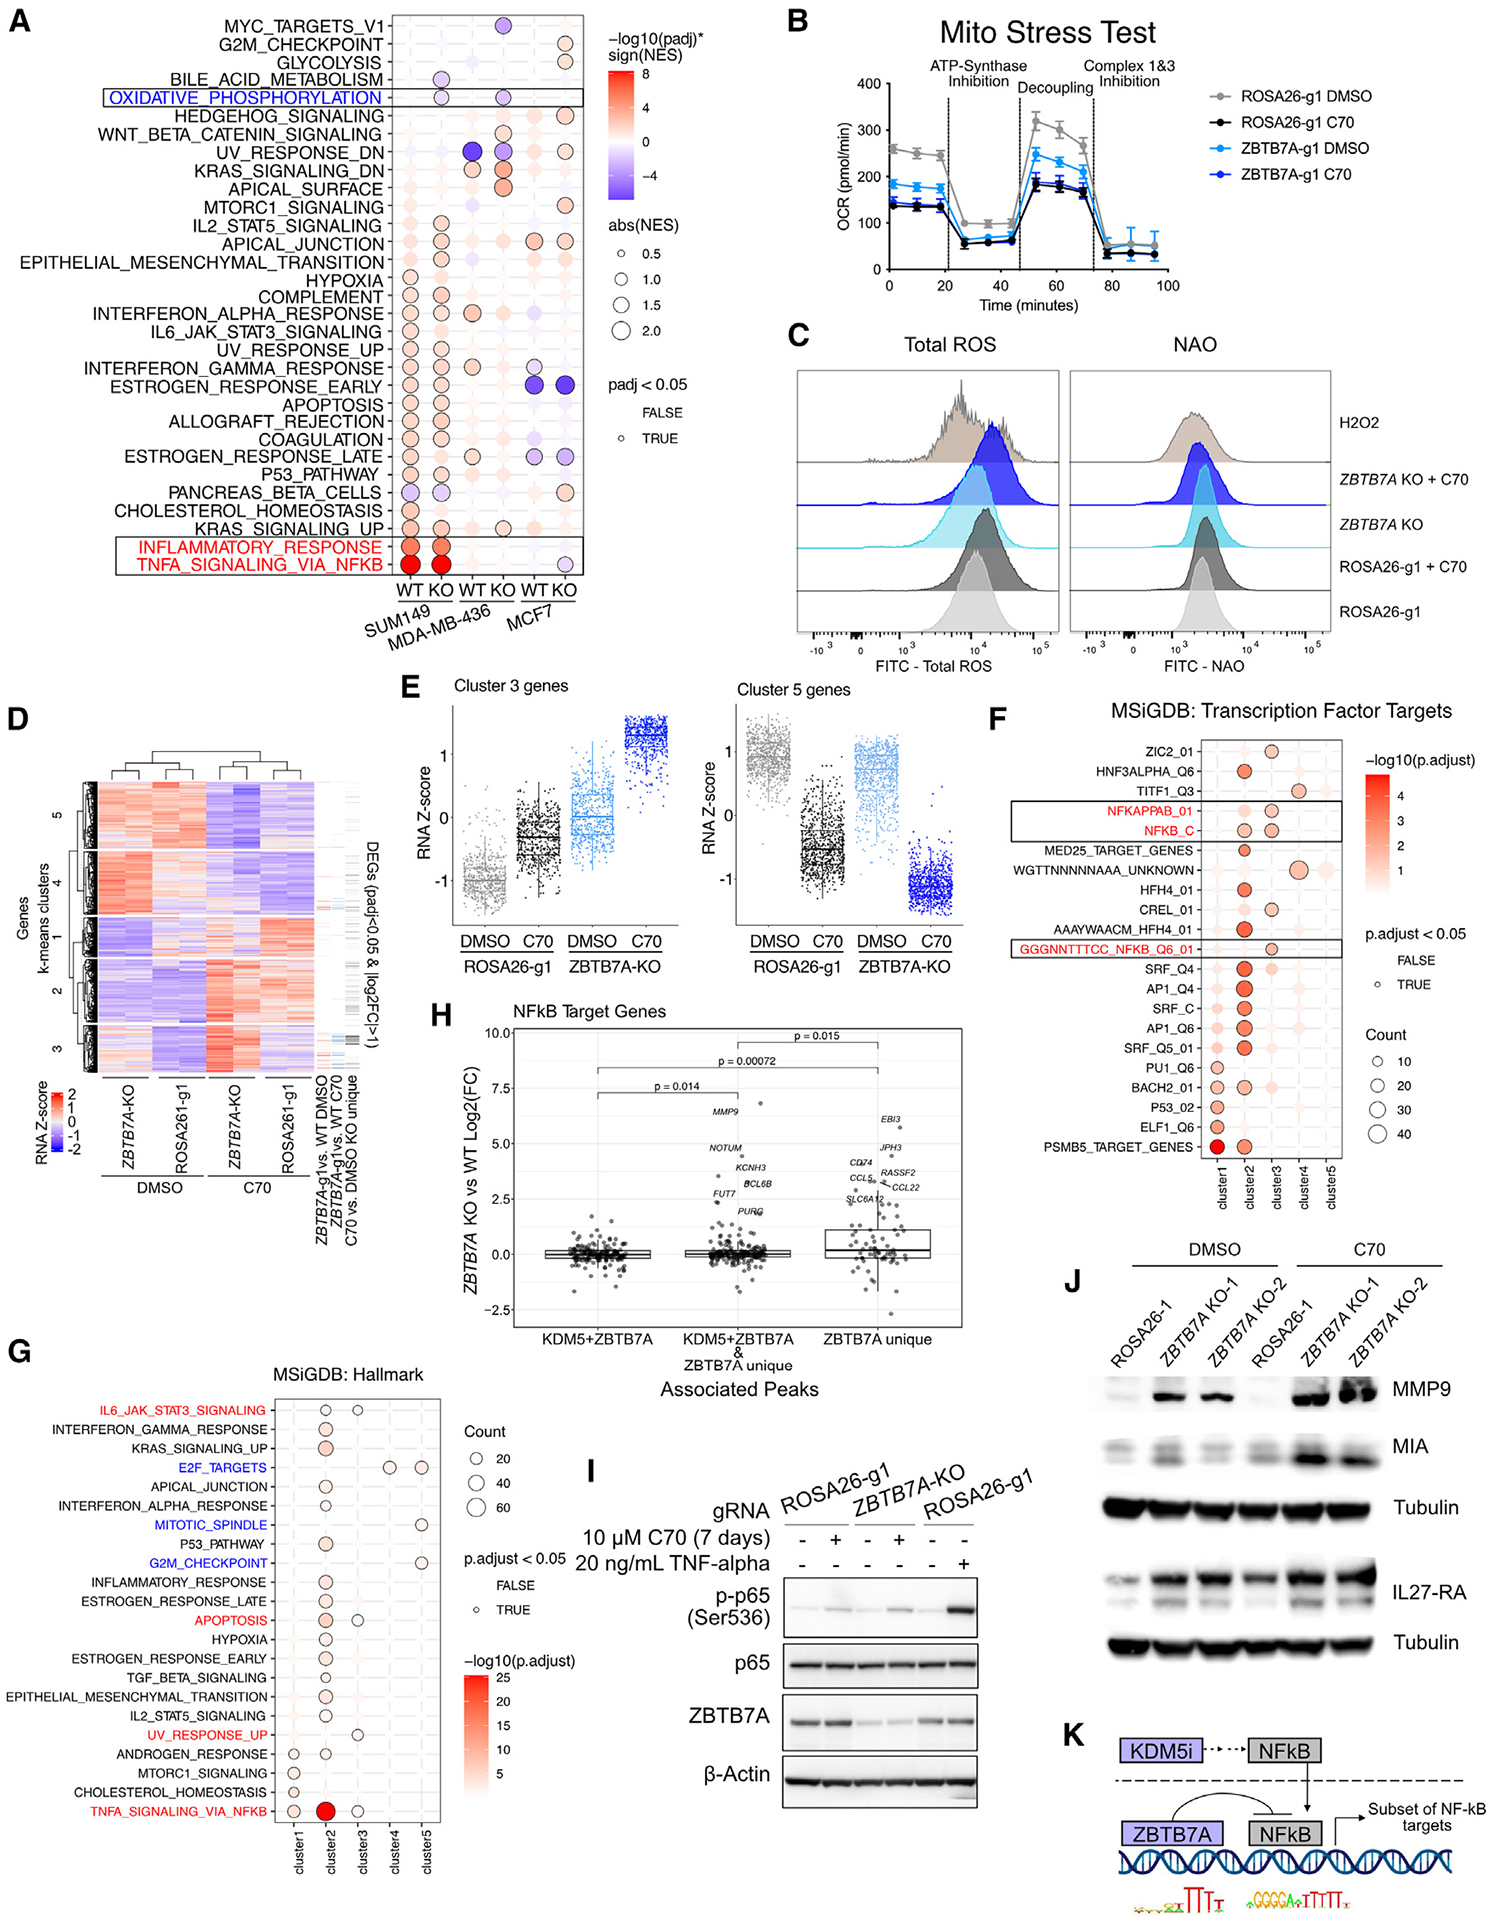
Figure 5. Effects of ZBTB7A KO on transcriptional response to KDM5 inhibition.

(A) GSEA on genes ranked by log2(FC) for ±10 μM C70 for 7 days. The analysis was performed in all three cell lines with wild-type (i.e., ROSA26-g1) or ZBTB7A KO.
(B) Oxygen consumption rate (OCR) in ROSA26-g1 and ZBTB7A KO SUM149 cells ± pre-treatment with 10 μM C70 for 6 days. Values are the mean ± standard deviation. N = 5 for all conditions except ZBTB7A KO + C70, which had one outlier well removed (N = 4).
(C) Ridge plot depicting flow cytometry for total ROS detection with the Total Reactive Oxygen Species (ROS) Assay Kit and for mitochondrial cardiolipins with nonyl acridine orange (NAO). SUM149 cells were treated with or without 10 μM C70 for 5 days. One millimolar H2O2 (7 h for ROS and 2 h for NAO) was used as a positive control.
(D) Heatmap of DEGs upon C70 treatment in either SUM149 ROSA26-g1 or ZBTB7A-g1 (padj < 0.05). Genes are ordered based on k-means clustering (k = 5) and samples are ordered based on hierarchical clustering.
(E) RNA Z scores of cluster 3 and 5 genes from (D). Box plots represent mean, first and third quantile, and min and max values.
(F and G) Overrepresentation analysis for (F) MSigDB transcription factor targets and (G) MSigDB Hallmark pathways within each gene cluster specified by (D).
(H) Plot of NF-κB target genes associated with KDM5 + ZBTB7A peaks, ZBTB7A unique peaks, or both (KDM5 + ZBTB7A and ZBTB7A unique). Target genes were defined by the union of MSigDB transcription factor target gene sets (GGGNNTTTCC_NFKB_Q6_01, NFKAPPAB_01, NFKAPPAB65_01, NFKB_C, NFKB_Q6_01, and NFKB_Q6). The p value was determined by the t test. Box plots represent mean, first and third quantile, and min and max values.
(I) Immunoblot for phospho-NF-κB p65 (Ser536) in SUM149 ROSA26-g1 and ZBTB7A KO cells ± 10 μM C70 for 7 days. Cells treated with 20 ng/mL TNF-α for 5 min were used as positive control. Image is the left side part of a larger blot with additional lanes.
(J) Immunoblot for NF-κB targets MMP9, MIA, and IL-27-RA in SUM149 ROSA26-g1 or ZBTB7A KO cell lines ± 10 μM C70 for 6 days. Tubulin was used as loading control.
(K) Diagram of proposed interaction between ZBTB7A and KDM5 inhibition on NF-κB signaling.
See also Figures S4 and S5.
