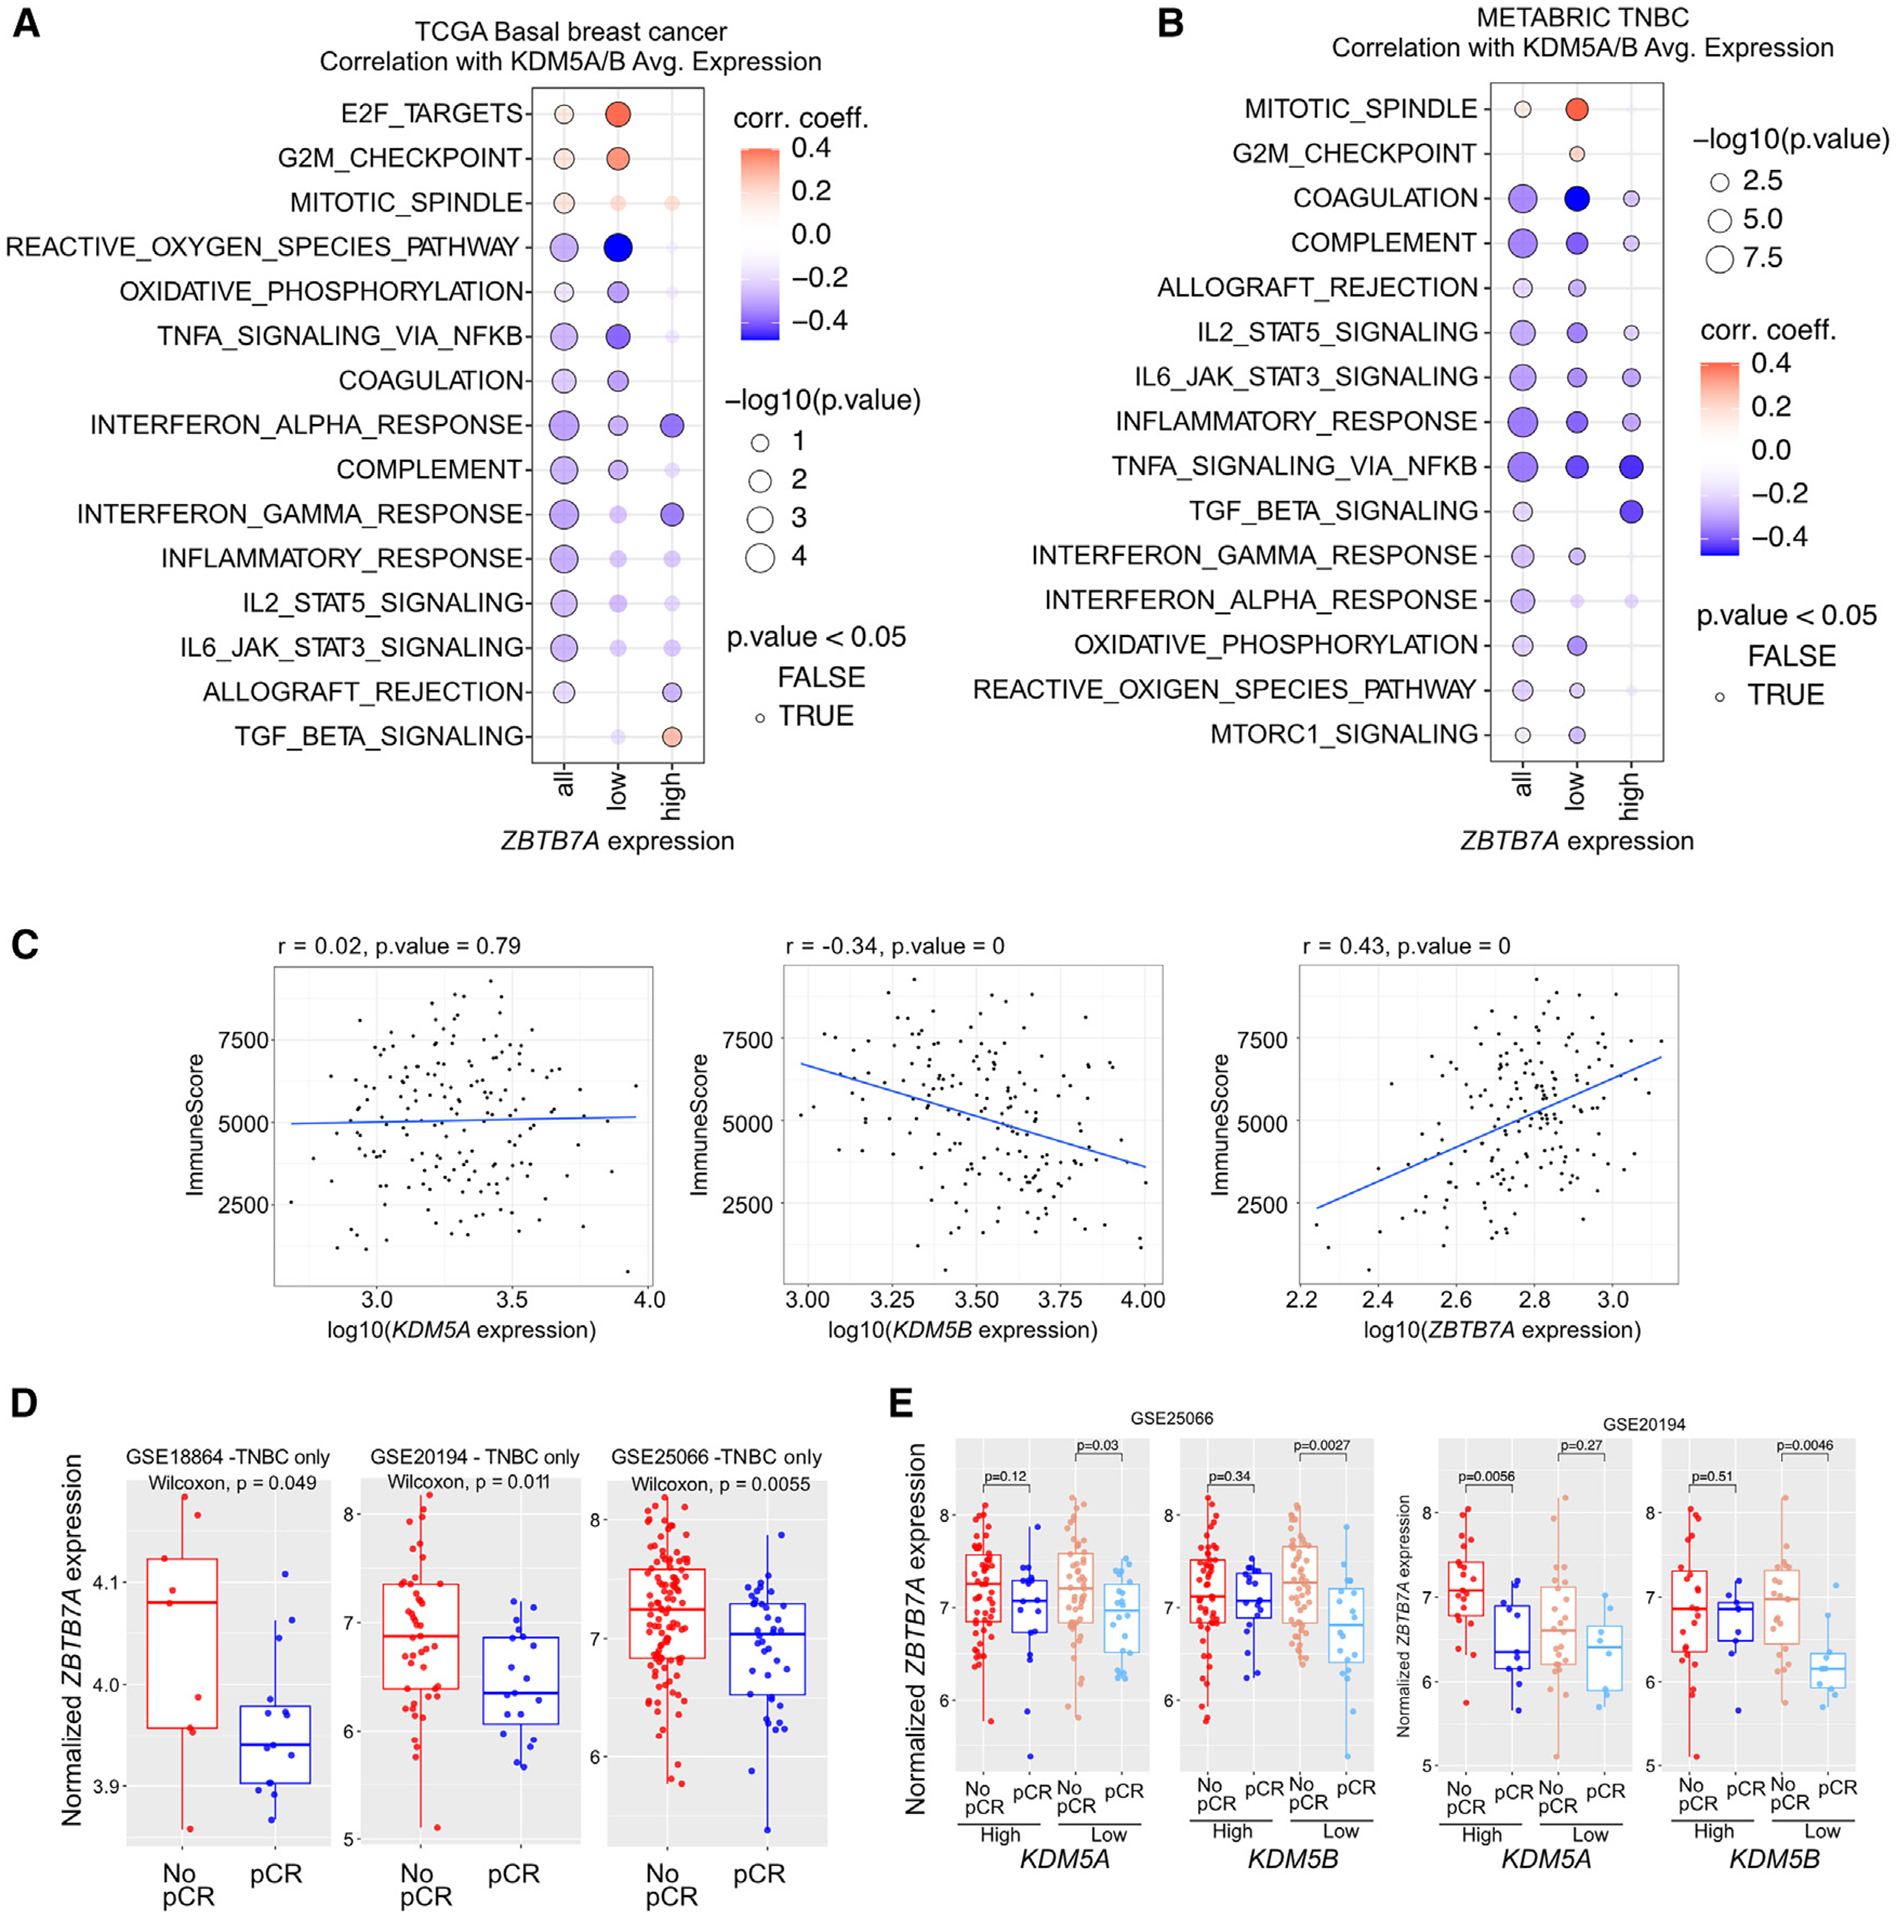
Figure 6. Associations between ZBTB7A and KDM5 expression and tumor features in patient samples.

(A and B) Correlation between KDM5A/B expression and select pathways across basal tumors from TCGA (A) and TNBC samples from METABRIC (B). Correlation coefficients and −log10(p) are plotted. The samples were subset into high and low ZBTB7A expression based on upper and lower tertiles.
(C) Correlation between KDM5A, KDM5B, and ZBTB7A expression with estimated immune infiltration scores from bulk RNA-seq data. Data are from basal tumors in TCGA. Immune scores were calculated from bulk RNA-seq via “Estimation of Stromal and Immune cells in Malignant Tumors Using Expression Data” (ESTIMATE).
(D) Boxplots depicting the expression of ZBTB7A in TNBC from patients with pCR or no pCR from the indicated cohorts. Box plots represent mean, first and third quantile, and min and max values. Mann-Whitney U test was used.
(E) Boxplots depicting the expression of ZBTB7A in breast tumors from patients with pCR or no pCR from the indicated cohorts and divided based on the expression levels of KDM5A or KDM5B. Box plots represent mean, first and third quantile, and min and max values. Mann-Whitney U test was used.
