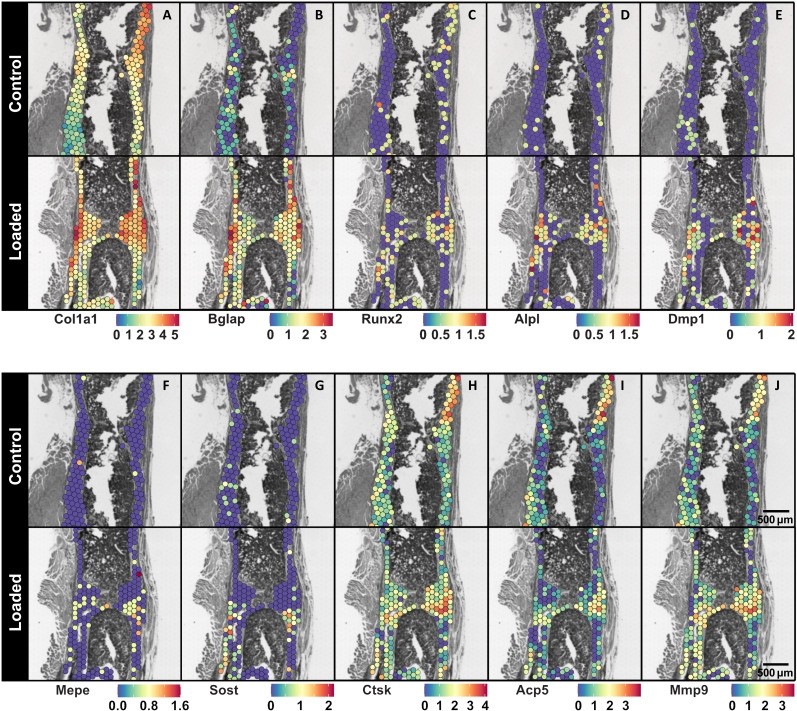
Fig. 4. Spatial gene expression maps of selected bone cell markers at the fracture site of Control and Loaded mice.
Visualization of the spatial expression patterns of osteoblast markers: (A) Col1a1, (B) Bglap, (C) Runx2, and (D) Alpl; osteocyte markers: (E) Dmp1, (F) Mepe, and (G) Sost; and osteoclast markers: (H) Ctsk, (I) Acp5, and (J) Mmp9 within the fracture sites of Control and Loaded mice is presented. Each legend denotes the normalized expression of the specified gene. Data presented (n = 1 per group) correspond to samples at 5 weeks after surgery. 3D visualizations of the morphology of these Control and Loaded fracture sites are presented in Fig. 2. Spatial transcriptomics spot size = 55 μm.

