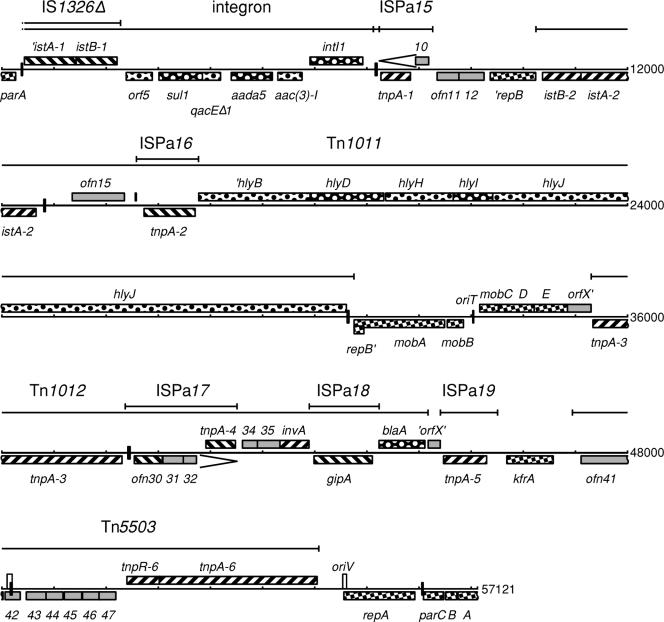
FIG. 1.
Linear map of Rms149. Bars above the map indicate the extent of mobile elements. Genes are shown above (sense strand) or below (complementary strand) the DNA line and filled according to known or putative function. Genes involved with plasmid functions are patterned with alternating squares, and phenotypic load genes are dotted. Genes involved with transposition are striped, with the direction being reversed for secondary insertions. Open reading frames of unknown function are shown in grey. Stem-loops are shown as black boxes over the DNA. The series of repeats in ofn42 is shown as a white box. The repeat between tnpA-1 and tnpA-4 is shown by chevrons.

