. 2025 Jan 2;13:RP96743. doi: 10.7554/eLife.96743

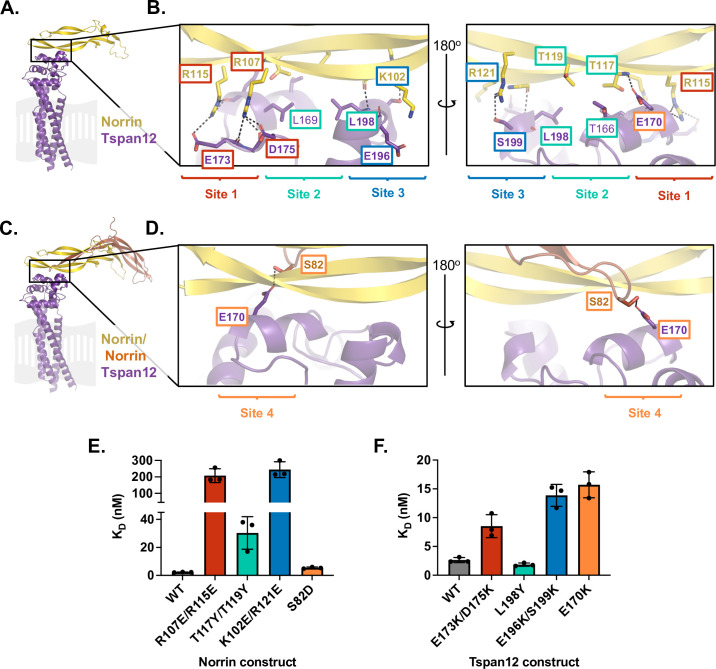
Figure 2. Mutational analysis of AlphaFold-predicted Tspan12-Norrin binding site.

(A) AlphaFold model of one Norrin protomer (yellow) bound to Tspan12 (purple), with the expected location of the plasma membrane shown in gray. (B) Zoomed view of the predicted Tspan12/Norrin binding site, front and rear view (flipped 180°). Predicted polar interactions are indicated with dark gray dashed lines. Within the binding interface, Site 1 (red), Site 2 (teal), and Site 3 (blue) are indicated. Bold residue labels indicate residues mutated for binding assays. (C) AlphaFold model of Tspan12 bound to Norrin dimer and (D) zoomed view of indicated area, showing the predicted polar interaction between residue S82 on the second Norrin protomer (orange) and residue E170 on Tspan12, termed Site 4 (orange). (E) Binding affinities (mean ± SD) for the indicated Norrin mutants binding to full-length wild-type (WT) Tspan12 and (F) WT Norrin binding to the indicated Tspan12 mutants, calculated from association and dissociation fits to biolayer interferometry (BLI) traces of 32 nM Norrin binding to Tspan12 in triplicate (see Figure 2—figure supplement 3A and B). Colors correspond to sites within the binding interface. Kinetic traces and kinetic constants are shown in Figure 2—figure supplement 3, and affinities and kinetic constants are reported in Supplementary file 1.

Figure 2—source data 1. Norrin-Tspan12 mutant affinities used to generate Figure 2E and F.

Figure 2.

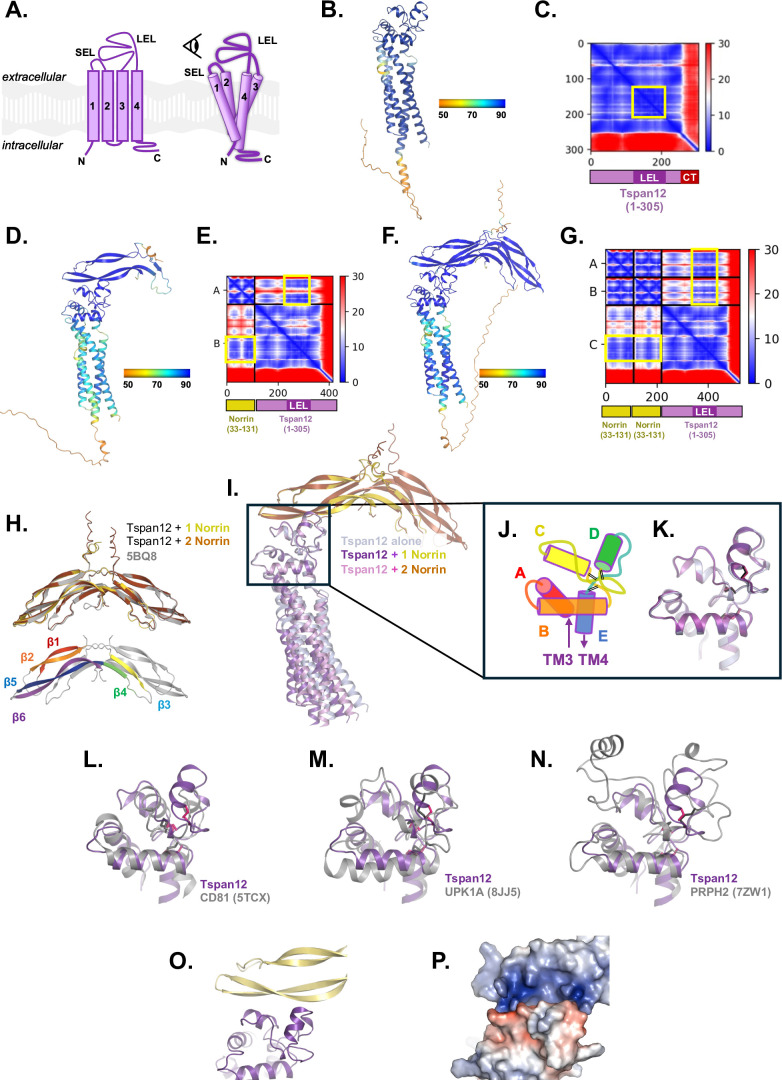
Figure 2—figure supplement 1. AlphaFold structural prediction of Tspan12 bound to Norrin.

Figure 2—figure supplement 1.

(A) Cartoon of tetraspanin structure, comprised of transmembrane helices 1–4, a small extracellular loop (SEL, between helices 1 and 2) and a large extracellular loop (LEL, between helices 3 and 4). Eye icon indicates the viewing angle of AlphaFold models in the remainder of this figure (B, D, F, I–P) relative to this cartoon. (B) The structure of full-length human Tspan12 alone was predicted with AlphaFold. The best-scoring model is shown, colored by the per-residue predicted local distance difference test (pLDDT) confidence metric. (C) The predicted aligned error (PAE) for the model in B. The position of the LEL (darker purple) appears as a darker blue square in the heat map with low PAE (yellow box). The position of C-terminal residues (‘CT‘, red) is indicated; the heat map shows high PAE values for the C-terminus relative to the rest of the protein, indicating poor prediction of the relative positioning of the C-terminus. (D) The structure of full-length human Tspan12 together with one Norrin protomer (residues 25–133) was predicted with AlphaFold-Multimer and the best-scoring model is shown, colored by pLDDT. (E) The predicted aligned error for the model shown in D. The position of Norrin, Tspan12, and the LEL along the axes are indicated. Note low PAE between the LEL and parts of Norrin (yellow boxes). (F) The structure of full-length human Tspan12 together with two copies of Norrin (residues 25–133) was predicted with AlphaFold-Multimer and the best-scoring model is shown, colored by pLDDT. (G) The predicted aligned error for the model shown in F. The position of both copies of Norrin, Tspan12, and the LEL along the axes are indicated. Note low PAE between the LEL and parts of both Norrin protomers (yellow boxes). (H) Top: The structure of Norrin within the predicted structure of Tspan12+1 Norrin protomer (yellow), and within the predicted structure of Tspan12+2 Norrin protomers (orange), matches the crystal structure of Norrin (5BQ8 chains A and B; gray) with RMSDs of 0.383 and 0.413 Å respectively. Below: β strands 1, 2, 3, 4, 5, and 6 of one Norrin protomer, colored red, orange, yellow, green, blue, and purple, respectively; strands 5 and 6 are predicted to comprise the Tspan12 binding site. (I) The predicted model of Tspan12 alone (light blue) is similar to the predicted models with one (purple/yellow) or two (pink/orange) copies of Norrin, which each align with RMSDs of 1.247 and 1.057 Å, respectively, to the model of Tspan12 alone. Aligning only the LELs as shown gives RMSDs of 0.293 and 0.341 Å, respectively, and illustrates the slight variation in the predicted angle between the TMs and the LEL. The predicted position and orientation of Norrin relative to the LEL is unchanged between the one-protomer and two-protomer models. (J) Tetraspanin LELs are composed of helices A, B, C, D, and E. Helices C and D are the least conserved and are implicated in binding partner interactions (Susa et al., 2024). Black double lines represent disulfide bridges. Viewing angle is indicated by the eye in A. (K) Close-up of aligned LELs from I. (L) The predicted structure of the Tspan12 LEL (from the 1 Tspan12 : 1 Norrin protomer model; residues 123–215; purple) aligns to the experimentally determined structure of CD81 LEL (5TCX residues 123–198; gray), with an RMSD of 3.997 Å. CD81 is a C4 tetraspanin; disulfide bonds for Tspan12 and CD81 are shown in pink and black, respectively. (M) The predicted Tspan12 LEL (purple) aligns to the Uroplakin 1A LEL (8JJ5, residues 125–226; gray), a C6 tetraspanin, with an RMSD of 4.215 Å. (N) The predicted Tspan12 LEL (purple) aligns to the Peripherin-2 LEL (7ZW1, residues 126–258; gray), a C6 tetraspanin, with an RMSD of 2.528 Å. (O) The predicted interaction between Norrin and Tspan12 involves helices C and D of the LEL and residues on β5 and β6 of Norrin. (P) The predicted interaction between Norrin and Tspan12 colored by surface electrostatics (APBS) shows a highly polar interaction involving a basic patch on Norrin and an acidic patch on Tspan12.
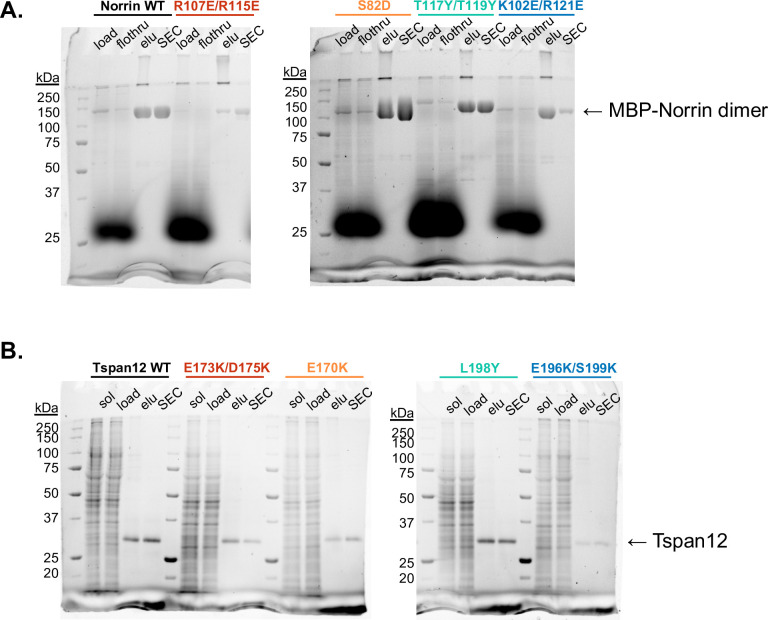
Figure 2—figure supplement 2. Purification of Norrin and Tspan12 mutants.

Figure 2—figure supplement 2.

(A) Stain-free non-reducing SDS-PAGE gels of Sf9 supernatant media (‘load’), amylose resin flowthrough (‘flothru’), amylose eluate (‘elu’), and pooled fractions after size exclusion (‘SEC’) for wild-type (WT) and indicated mutant MBP-Norrin. (B) Stain-free SDS-PAGE gels of DDM-solubilized Expi293 membranes (‘sol’), supernatant post-ultracentrifugation (‘load’), 1D4 antibody resin eluate (‘elu’), and pooled fractions after size exclusion (‘SEC’) for full-length WT and indicated mutant Tspan12.
Figure 2—figure supplement 2—source data 1. Original files of gels in Figure 2—figure supplement 2.
Figure 2—figure supplement 2—source data 2. Labeled gels in Figure 2—figure supplement 2.
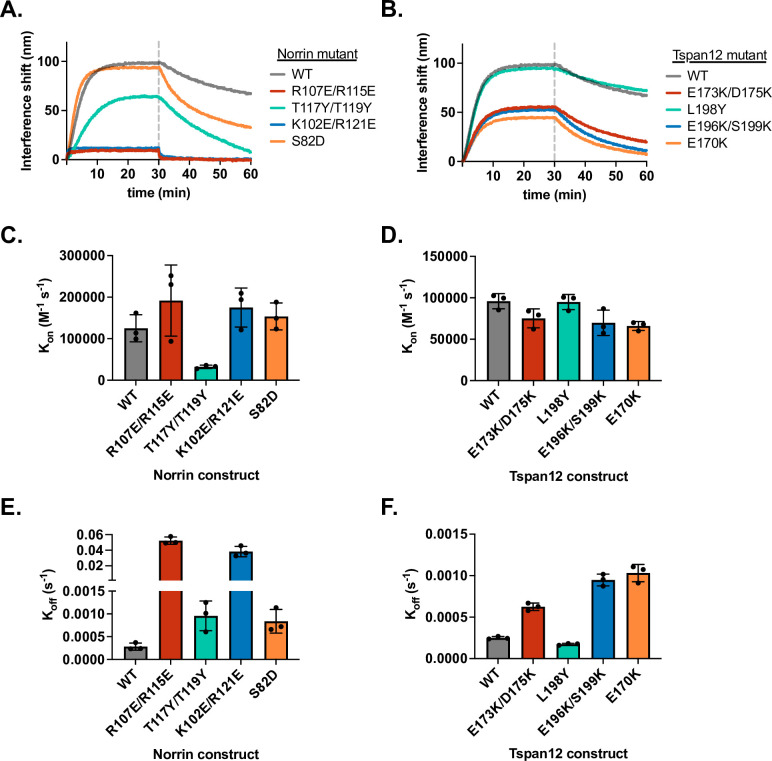
Figure 2—figure supplement 3. Binding kinetics of Norrin and Tspan12 mutants.

Figure 2—figure supplement 3.

(A) Representative biolayer interferometry (BLI) association and dissociation traces of 32 nM wild-type (WT) or mutant Norrin binding to immobilized WT Tspan12, and for (B) 32 nM WT Norrin binding to immobilized WT or mutant Tspan12. Colors correspond to sites within the binding interface defined in Figure 2. (C and D) Rate constant Kon (mean ± SD) calculated from association and dissociation fits to traces shown in A and B, respectively; each mutant was measured in triplicate. (E and F) Rate constant Koff (mean ± SD) calculated from dissociation fits to traces shown in A and B, respectively; each mutant was measured in triplicate. Across the board, differences in KD for mutants compared to WT (Figure 2E and F) were driven largely by differences in Koff. Kinetic constants reported in Supplementary file 1.
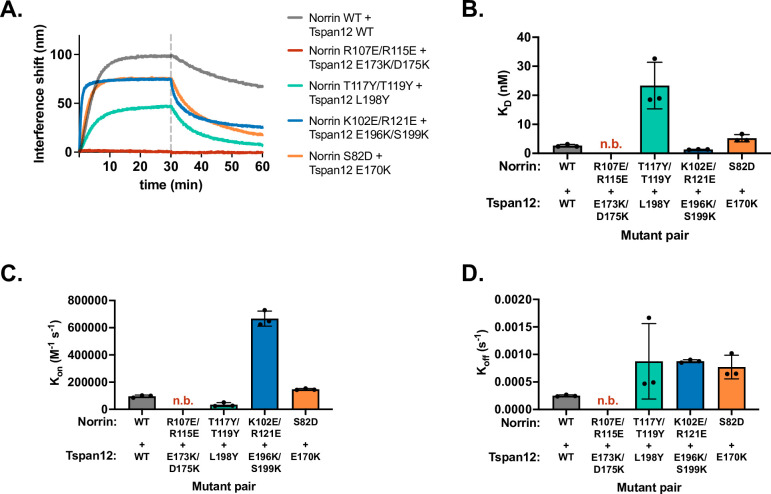
Figure 2—figure supplement 4. Binding affinity and kinetics of mutant Norrin binding to mutant Tspan12.

Figure 2—figure supplement 4.

(A) Representative biolayer interferometry (BLI) association and dissociation traces showing 32 nM mutant Norrin binding to immobilized mutant Tspan12 relative to the WT/WT binding (gray) for mutants at Site 1 (red), Site 2 (teal), Site 3 (blue), and Site 4 (orange). For each site, mutated residues on Norrin and Tspan12 are predicted to interact according to the AlphaFold structure; in the case of charge-swapped mutations (i.e., Sites 1, 3, and 4), we hypothesized that the mutations to the two proteins may be compensatory. (B) Binding affinities calculated from kinetic fits to traces in A for the indicated mutant pairs. The charge-swapped mutants at Site 1, Norrin R107E/R115E and Tspan12 E173K/D175K, do not bind appreciably at 32 nM Norrin. At Site 3, charge-swapped Norrin K102E/R121E and Tspan12 196K/S199K binding is rescued to WT/WT levels compared to the much weaker binding affinities of either mutant for its WT counterpart: i.e., the mutations are compensatory. At Site 4, the Norrin S82D mutation partially rescues the deleterious effects of Tspan12 E170K. Data represent mean ± SD from three replicates. Binding affinities and kinetic constants reported in Supplementary file 1. (C) Kon and (D) Koff, calculated from each individual trace shown in A, measured in triplicate. Plots represent three replicates ± SD, and kinetic constants are reported in Supplementary file 1. WT, wild-type.