. 2025 Jan 2;13:RP96743. doi: 10.7554/eLife.96743

Figure 4. Tspan12 enhances Norrin-Fzd4 binding, cell-surface binding, and Norrin-stimulated β-catenin signaling at low Norrin concentrations.

(A) Steady-state binding curves of monomeric Tspan12∆C, monomeric Fzd4, or heterodimeric Tspan12∆C/Fzd4∆C receptors in biotinylated nanodiscs binding to dimeric or (B) monomeric (C93A/C95A/C131A) Norrin by biolayer interferometry (BLI). Steady-state binding signal is plotted as a percent of Bmax for three independent replicates (mean ± SD). Affinities and kinetic constants are reported in Supplementary file 1. (C) Indicated concentrations of Norrin-1D4 dimer binding to Expi293 cells transfected with Fzd4, Tspan12, or both Fzd4 and Tspan12, detected with fluorescently labeled Rho1D4 antibody and quantified by flow cytometry. Mean ± SD of three independent experiments are plotted. Co-transfection of Tspan12 increased Norrin recruitment to Fzd4-transfected cells at 0.1, 0.32, 1, and 3.2 nM Norrin (two-tailed t-test p-values of 0.00026, 0.00079, 0.0049, and 0.0018, respectively). (D) β-Catenin pathway activation resulting from increasing concentrations of Norrin was assessed in Fzd1/2/4/5/7/8-knockout HEK293T cells transfected with Tspan12 siRNA or increasing amounts of Tspan12 plasmid, along with Fzd4 and TopFlash luciferase reporter plasmids. Data are plotted as mean ± SD from triplicate wells are representative of three independent experiments.

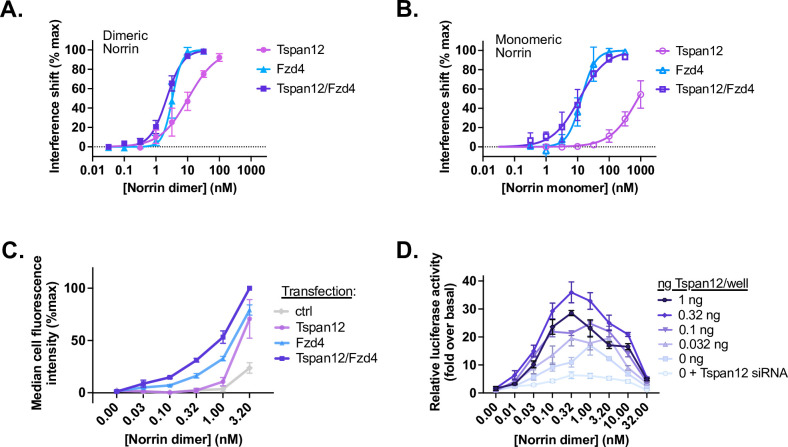
Figure 4—source data 1. Interference shift, cell fluorescence, and luciferase activity values used to generate Figure 4A–D.

Figure 4.

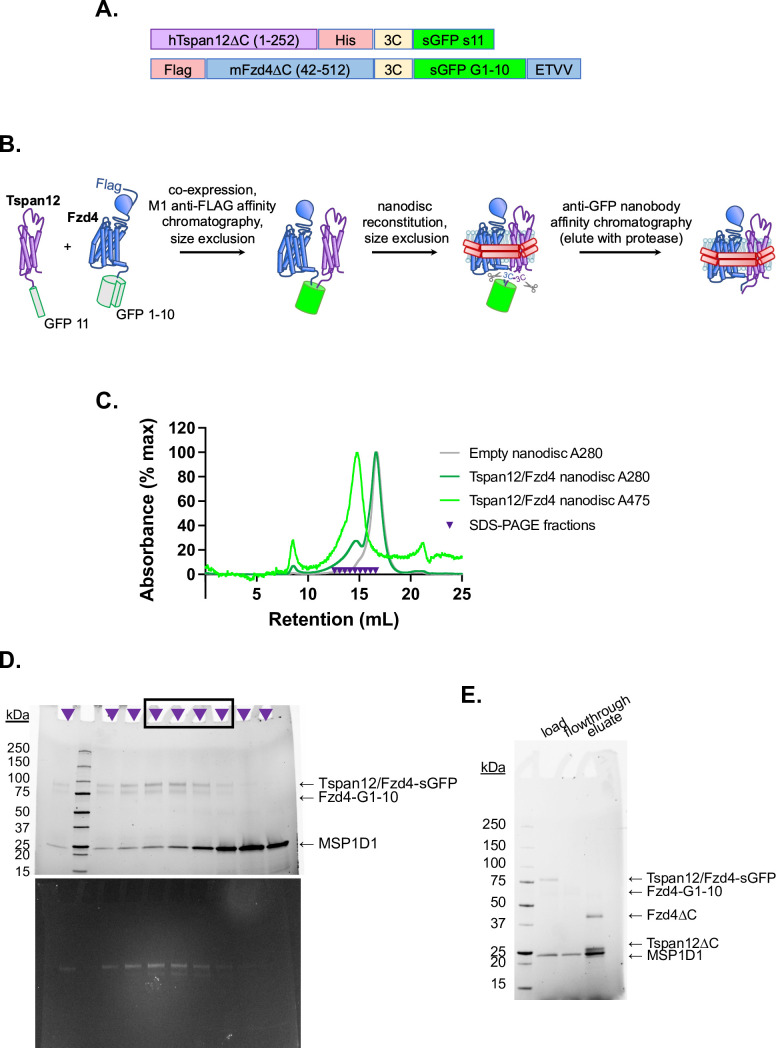
Figure 4—figure supplement 1. Purification of Fzd4/Tspan12 dimer and insertion into nanodiscs.

Figure 4—figure supplement 1.

(A) Construct design of Tspan12 and Fzd4 C-terminally tagged with split GFP fragments s11 and s1–10, respectively, both downstream of a 3C protease recognition sequence. Fzd4 is additionally tagged with an N-terminal FLAG tag and Tspan12 is additionally tagged with a C-terminal 6xHis tag. The Fzd4 C-terminal PDZ ligand (ETVV) is appended after split GFP to improve expression and surface localization (Bruguera et al., 2022). (B) Schematic of Tspan12/Fzd4 heterodimer expression and purification. The constructs in A were co-expressed in Sf9 cells, solubilized in n-dodecyl-β-D-maltopyranoside (DDM), and co-purified on M1 anti-FLAG affinity resin followed by size exclusion chromatography. The dimer was reconstituted into nanodiscs and further purified by size exclusion followed by capture on anti-GFP nanobody resin, from which it was eluted by 3C protease. (C) Size exclusion traces of empty nanodiscs or Tspan12/Fzd4 dimer reconstituted into excess nanodiscs, with absorbance detected at 280 and 475 nm (GFP absorption peak), on a Superose 6 Increase column. Indicated fractions were pooled for (D) SDS-PAGE, imaged using StainFree imaging (above) or GFP fluorescence (below); intact GFP is SDS-resistant. Fractions on the right side of the peak (boxed) were pooled in order to exclude any potential separately-reconstituted dimers (i.e., two nanodiscs with one receptor each, linked together by the GFP moiety). (E) Pooled fractions were purified by GFP nanobody resin and eluted with 3C protease. The load, flowthrough, and eluate are shown.
Figure 4—figure supplement 1—source data 1. Original files of gels in Figure 4—figure supplement 1.
Figure 4—figure supplement 1—source data 2. Labeled gels in Figure 4—figure supplement 1.
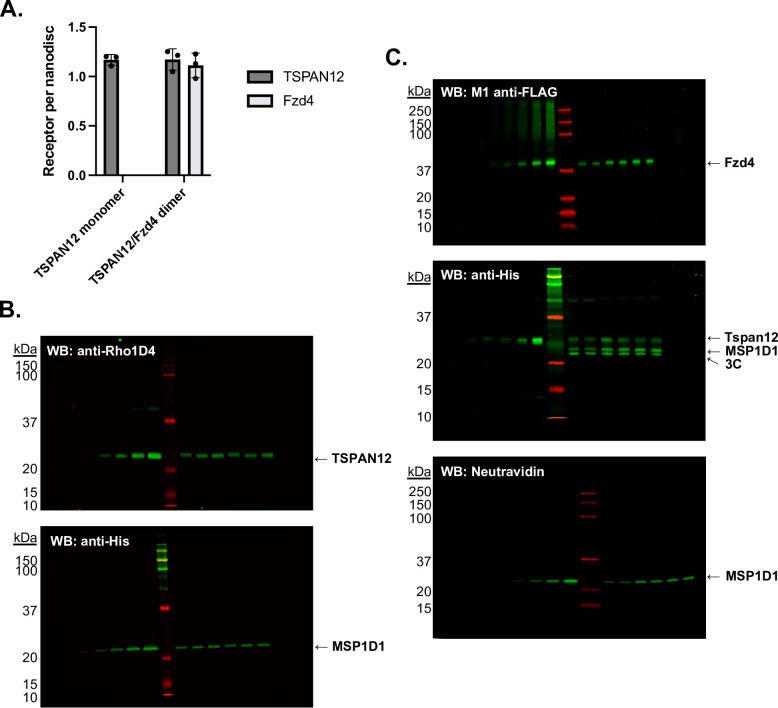
Figure 4—figure supplement 2. Stoichiometry of receptors in nanodiscs was determined by quantitative western blot.

Figure 4—figure supplement 2.

(A) Receptors per nanodisc in monomeric Tspan12 (mean ± SEM 1.17±0.05 Tspan12 per two MSP1D1) and heterodimeric Tspan12/Fzd4 nanodiscs (1.17±0.11 Tspan12 and 1.11±0.12 Fzd4 per two MSP1D1) as calculated from three independent samples each, with each component measured three times each by quantitative western blot. (B) Representative anti-Rho1D4 (top) and anti-His (bottom) western blots to quantify Tspan12-1D4 and His-MSP1D1, respectively, in monomeric Tspan12 reconstitutions. A known dilution series of purified protein was loaded in left lanes to generate a standard curve in the linear range of detection, against which dilutions of three nanodisc reconstitutions, loaded in duplicate in right lanes, were compared. (C) Representative anti-FLAG (top), anti-His (middle), and Neutravidin-800 (bottom) western blots to quantify FLAG-Fzd4, Tspan12-His, and biotinylated MSP1D1, respectively, in Tspan12/Fzd4 heterodimer preparations.
Figure 4—figure supplement 2—source data 1. Original files of western blots in Figure 4—figure supplement 2.
Figure 4—figure supplement 2—source data 2. Labeled western blots in Figure 4—figure supplement 2.
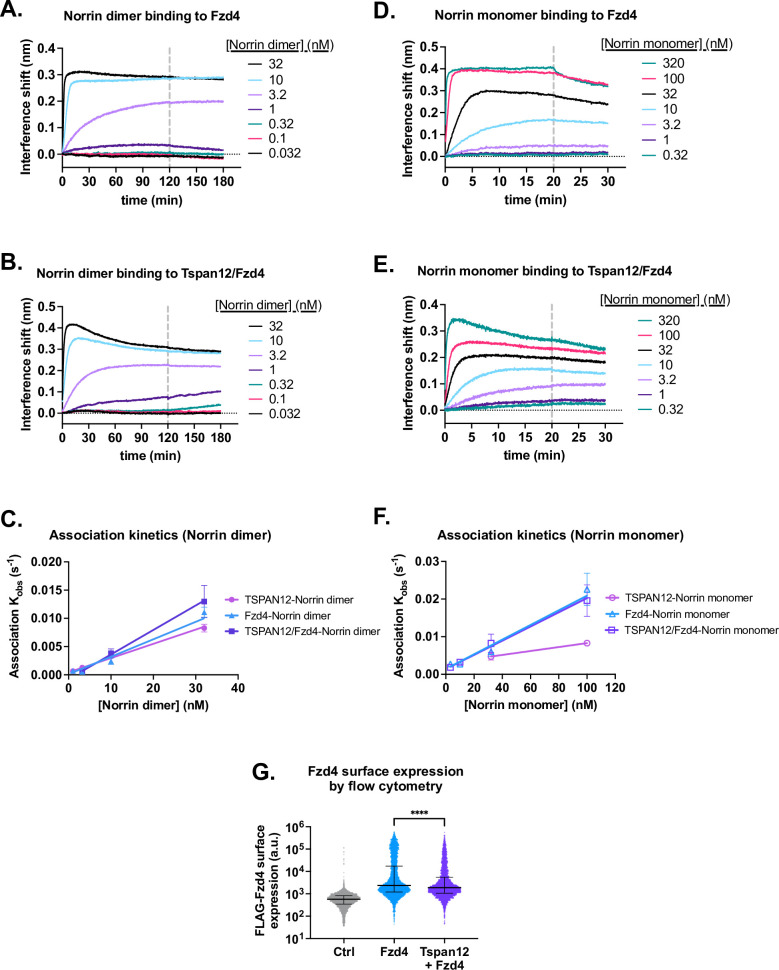
Figure 4—figure supplement 3. Tspan12 enhances Norrin recruitment.

Figure 4—figure supplement 3.

(A) Representative biolayer interferometry (BLI) association and dissociation traces of dimeric Norrin binding to Fzd4 monomer or (B) Tspan12/Fzd4 heterodimer in nanodiscs. (C) Observed association rate constant Kobs of Norrin dimer binding to Tspan12, Fzd4, or Tspan12/Fzd4 heterodimer in nanodiscs, plotted against Norrin concentration. Linear fits were used to obtain association rate constants reported in Supplementary file 1. Data represent mean ± SD for three independent replicates. (D) Representative BLI association and dissociation traces of monomeric Norrin (C93A/ C95A/C131A) binding to Fzd4 monomer or (E) Tspan12/Fzd4 heterodimer in nanodiscs. (F) Observed association rate constant Kobs (mean ± SD) of Norrin monomer binding to Tspan12, Fzd4, or Tspan12/Fzd4 heterodimer in nanodiscs, plotted against Norrin monomer concentration. (G) Fzd4 surface expression on Expi293 cells transfected with empty vector, FLAG-Fzd4, or FLAG-Fzd4+Tspan12, which were then stained with M1 anti-FLAG antibody conjugated to Alexa Fluor 647. Cell fluorescence is measured by flow cytometry and plotted along with the median and interquartile range. Co-expression of Tspan12 modestly but significantly decreases surface expression of Fzd4 (Mann-Whitney test, p-value<0.0001 in each of three independent experiments).
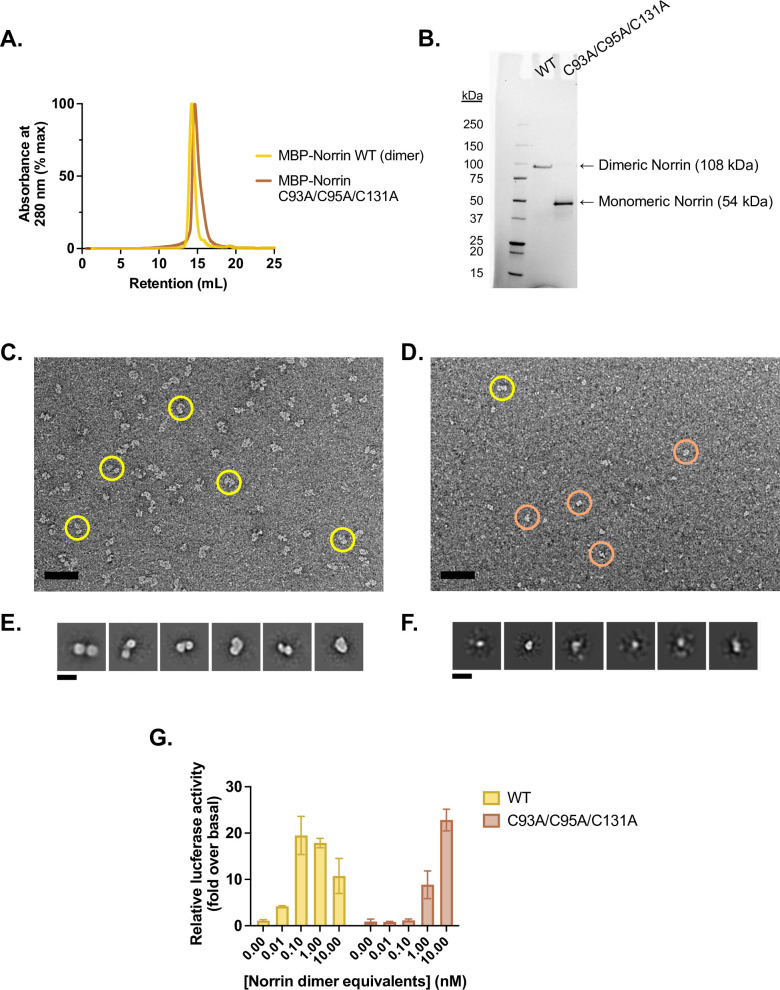
Figure 4—figure supplement 4. Purification and validation of monomeric Norrin.

Figure 4—figure supplement 4.

(A) Analytical size exclusion traces of wild-type (WT) (dimeric) MBP-Norrin (yellow) and MBP-Norrin rendered monomeric (brown) via mutations C93A/C95A/C131A to eliminate the intermolecular disulfides. Purified protein was injected at 25 µM on a Superdex 200 Increase 10/300 column, resulting on an on-column concentration in excess of 2.5 µM assuming a 10-fold on-column dilution factor. (B) Non-reducing SDS-PAGE gel of WT and C93A/C95A/C131A MBP-Norrin. (C) Uranyl acetate negative stain micrograph of WT MBP-Norrin, prepared at 100 nM. Scale bar is 50 nm. Representative picked particles indicated in yellow. (D) Uranyl acetate negative stain micrograph of MBP-Norrin C93A/C95A/C131A, prepared at 100 nM. Scale bar is 50 nm. Representative picked particles indicated with circles. Yellow-circled particle appears to be large enough to potentially be a dimer; brown circles show some smaller species, which dominate. (E) 2D class averages of picked particles from C show two lobes, consistent with two copies of MBP-Norrin (54 kDa each). (F) 2D class averages of picked particles from D show small, single particles that are hard to align; they are about half the size of particles in E, consistent with one copy of MBP-Norrin. This suggests that MBP-Norrin C93A/C95A/C131A is monomeric at 100 nM. (G) β-Catenin transcriptional activity in response to 0.01–10 nM purified WT (dimeric) or 0.02–20 nM C93A/C95A/C131A (monomeric) Norrin, in Fzd1/2/4/5/7/8-knockout HEK293T cells transfected with Fzd4 and TopFlash luciferase reporter plasmids. Data are plotted as mean ± SD from n=3 replicate wells.
Figure 4—figure supplement 4—source data 1. Original file of gel in Figure 4—figure supplement 4.
Figure 4—figure supplement 4—source data 2. Labeled gel in Figure 4—figure supplement 4.