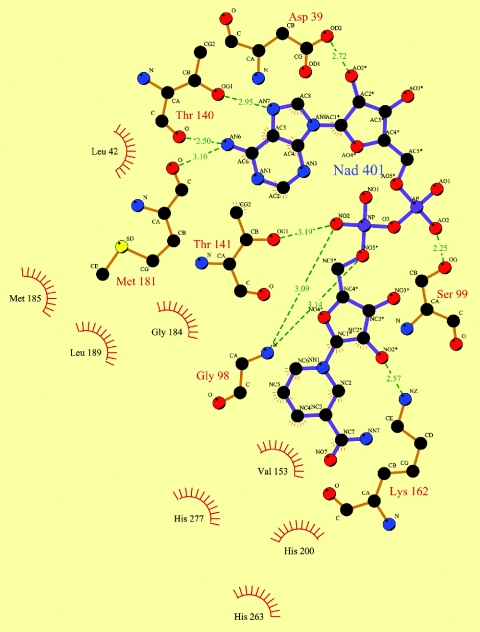
FIG. 6.
Diagram of the interactions of NAD+ with FucO. Carbon atoms are represented by black circles, oxygen atoms are represented by red circles, and nitrogen atoms are represented by blue circles. Hydrogen bonds are indicated by dashed green lines. The spiked atoms are the atoms involved in hydrophobic contacts, and the spiked circle segments surround hydrophobic van der Waals partners. The diagram was drawn with LIGPLOT (44).

