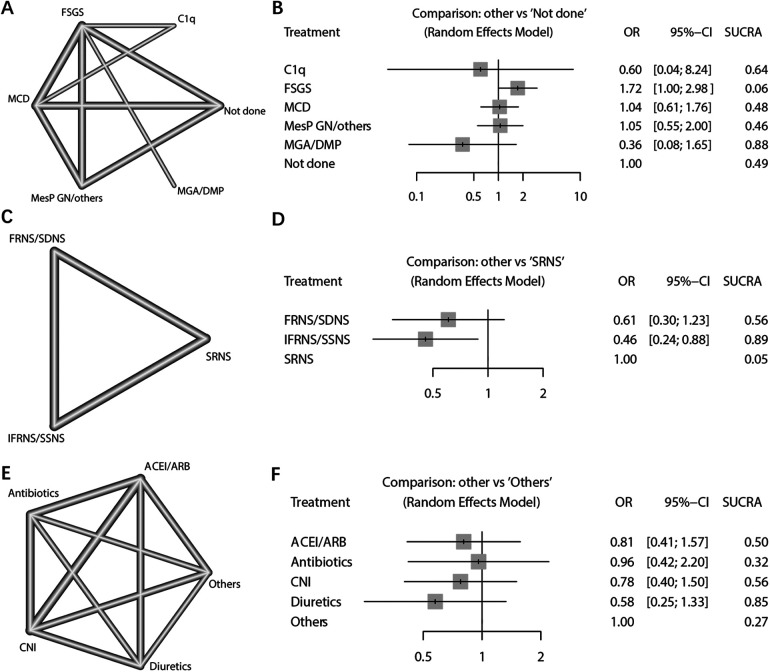
Figure 5.
Network meta-analysis of NS pathological types, steroid-response NS types, and nephrotoxic drug types. (A) Network plot of pathological results; (B) Network Forest plot of pathological results; (C) Network plot of steroid response type results; (D) Network Forest plot of steroid response type results; (E) Network plot of types of nephrotoxic drugs; (F) Network Forest plot of types of nephrotoxic drugs.

