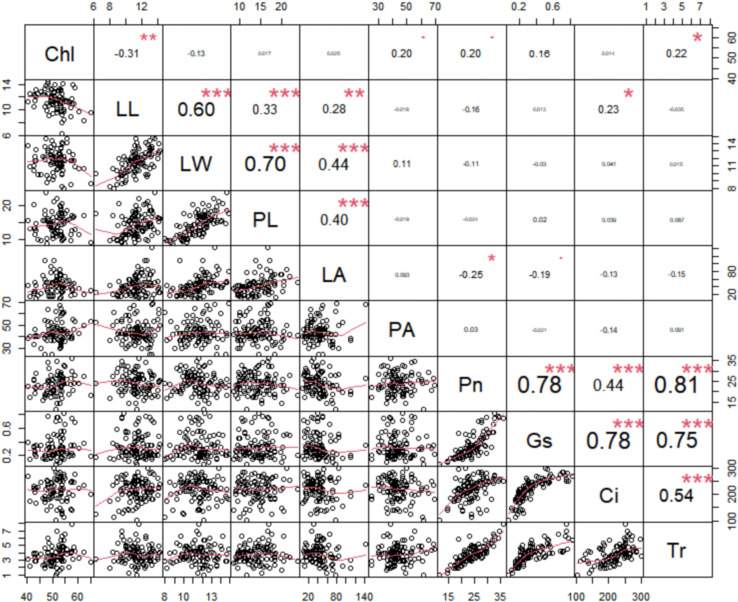
Figure 2.
Pairwise Pearson correlation among the ten photosynthetic and leaf morphological traits in rapeseed. The upper triangle of the matrix illustrates the Pearson correlation coefficients for each pair of traits, with positive values indicating positive correlations and negative values indicating inverse correlations. Conversely, the lower triangle displays the linear regression statistics for pairs of traits. net photosynthetic rate (Pn), leaf chlorophyll content (Chl), transpiration rate (Tr), intercellular carbondioxide concentration (Ci), stomatal conductance (Gs), petiole angle (PA), leaf area (LA), leaf length (LL), leaf width (LW), and petiole length (PL). ***: Indicates p-value less than 0.001, **: Indicates p-value less than 0.01, *: Indicates p-value less than 0.05, The font size represents the strength of the correlation, with larger fonts indicating stronger correlations and smaller fonts indicating weaker correlations.

