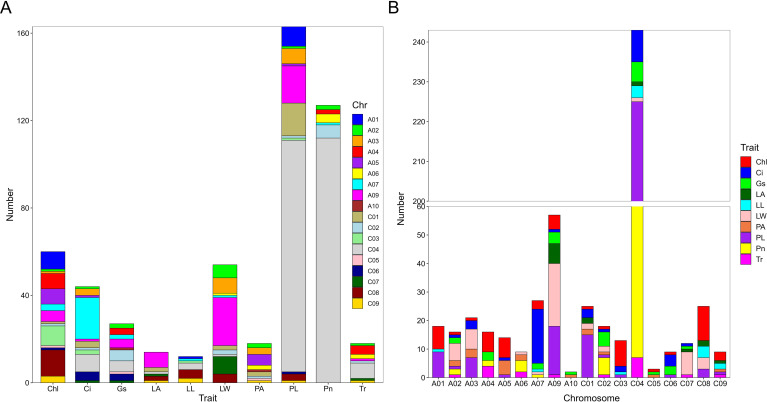
Figure 5.
Number of QTNs associated with photosynthetic and leaf morphological traits. (A) Number of QTNs significantly associated with each trait. The horizontal axis represents different traits, and the vertical axis represents the number of detected QTNs. Different colors represent QTNs identified on different chromosomes. (B) Number of QTNs significantly associated with traits on different chromosomes. The horizontal axis represents different chromosomes, and the vertical axis represents the number of detected QTNs. Different colors represents QTNs identified by different traits. net photosynthetic rate (Pn), leaf chlorophyll content (Chl), transpiration rate (Tr), intercellular carbondioxide concentration (Ci), stomatal conductance (Gs), petiole angle (PA), leaf area (LA), leaf length (LL), leaf width (LW), and petiole length (PL).

