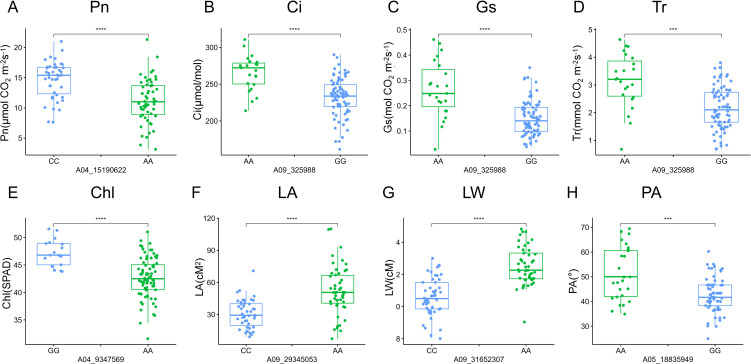
Figure 6.
Phenotypic difference between two genotypes of QTNs significantly associated with different traits. (A-H) Box plots of allelic phenotypic variations of QTNs for the following traits: net photosynthetic rate (Pn), intercellular carbondioxide concentration (Ci), stomatal conductance (Gs), transpiration rate (Tr), leaf chlorophyll content (Chl), leaf area (LA), leaf width (LW), and petiole angle (PA). The vertical axes of A-H represent Pn, Ci, Gs, Tr, Chl, LA, LW, and, PA, respectively. Significant differences between the alleles were assessed using a two-tailed t-test, *** indicates P < 0.001, **** indicates P < 0.0001.

