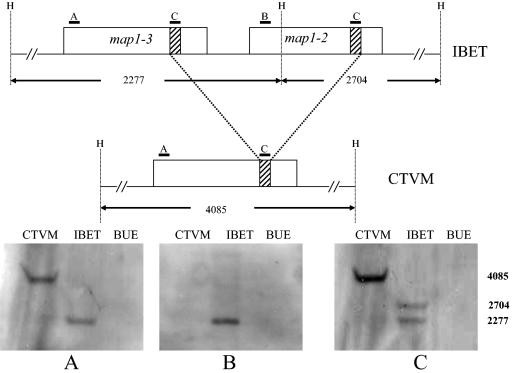
FIG. 3.
Southern blot on HindIII-digested genomic DNA. The top shows a schematic representation of the genomic region containing map1-3 and map1-2 with the position of the HindIII restriction sites (H) and the location of the different probes (A to C). The bottom shows the genomic Southern blot with probe MAP1-3F (A), MAP1-2F (B), and the recombination site (C). BUE indicates uninfected endothelial cells.

