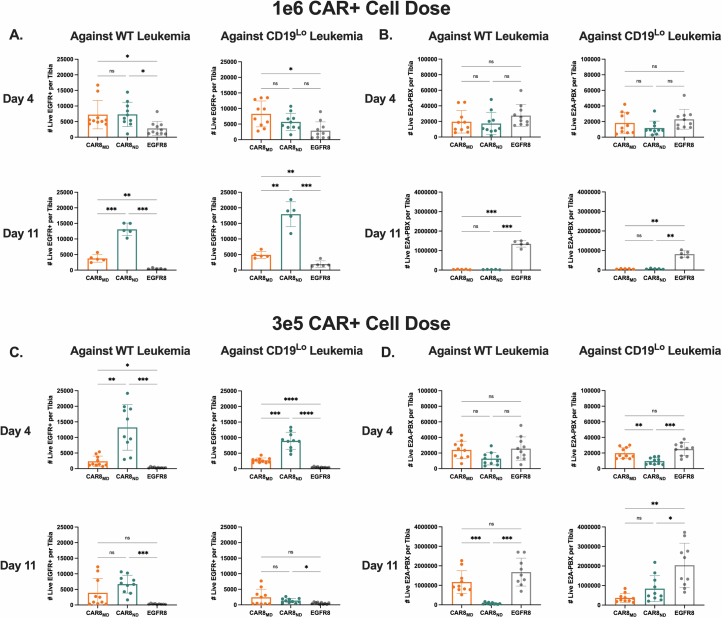
Extended Data Fig. 3. CAR T cells and leukemia counts per tibia for in vivo data.
Data are related to Figs. 2 and 3. All analyses in this figure are done on the same experiments described in Figs. 2 and 3. Counts data was generated by flushing a single tibia and using total tibia counts and cytometer proportions data to calculate CAR and leukemia cell counts per tibia. 3 A: CAR counts for 1e6 CAR dose experiments. (Exact p values, left to right then top to bottom: 0.0472, 0.0203, 0.0111, 0.0001, 0.0099, 0.0004, 0.0111). 3B: Leukemia counts for 1e6 CAR dose experiments. (Exact p values, left to right then top to bottom: 0.0002, 0.0002, 0.0014, 0.0014). 3 C: CAR counts for 3e5 CAR dose experiments. (Exact p values, left to right then top to bottom: 0.0029, 0.0127, 0.0010, 0.0001, <0.0001, <0.0001, 0.0002, 0.0184). 3D: Leukemia counts for 3e5 CAR dose experiments. (Exact p values, left to right then top to bottom: 0.0041, 0.0005, 0.0006, 0.0004, 0.0029, 0.0321). Data are from 2 pooled, independent experiments with n = 10 mice per condition, apart from the 1e6 CAR dose day 11 timepoint, which contains data from one experiment with n = 5 mice per condition. Statistical comparisons were performed using one-way Brown-Forsythe and Welch ANOVA with two-sided Dunnett’s T3 multiple comparisons test. Data represent mean +/− SD. * p < 0.05, ** p < 0.01, *** p < 0.001, **** p < 0.0001.

