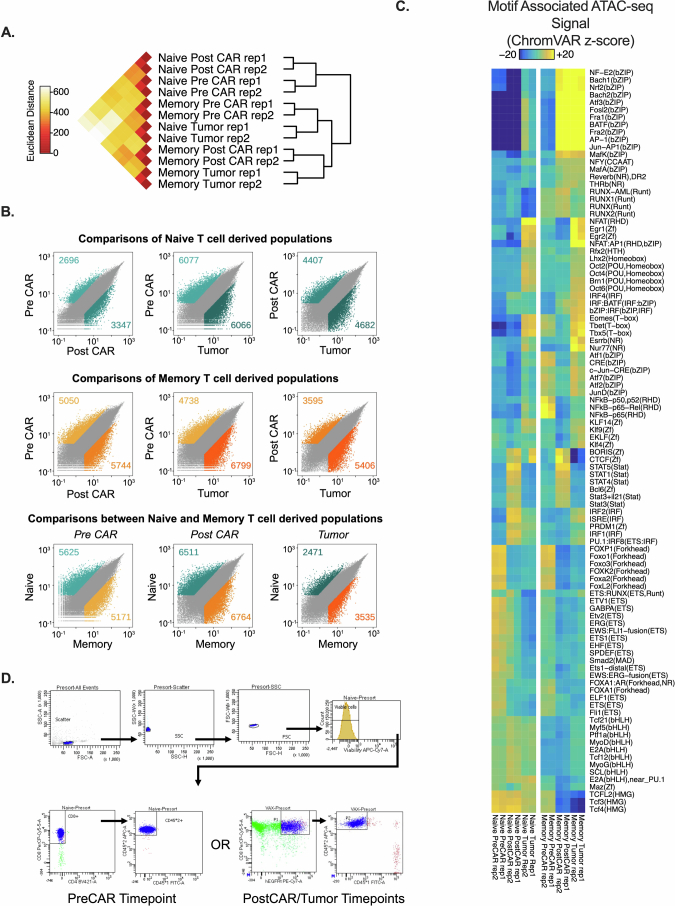
Extended Data Fig. 6. Additional analyses of ATAC-seq data.
Data are related to Fig. 4. All analyses in this figure are from the same timeline/experimental layout described in Fig. 4a. 6A: Inter-replicate Euclidian distance of voom-normalized ATAC-seq counts per peak between biological replicates. 6B: Pairwise comparisons of differentially accessible chromatin regions within conditions between different timepoints of the same condition, or between different conditions at each timepoint. Data points are mean of voom-normalized ATAC-seq counts per peak between biological replicates of each group. 6C: Heatmap of motif-associated ChromVAR deviation z-scores patterns of motif-associated ATAC-seq signal for indicated transcription factors. List comprises all significant differentially accessible comparisons. 6D: Representative gating for sorting of cells in sequencing experiments. Additional statistical analyses described in Methods section.

