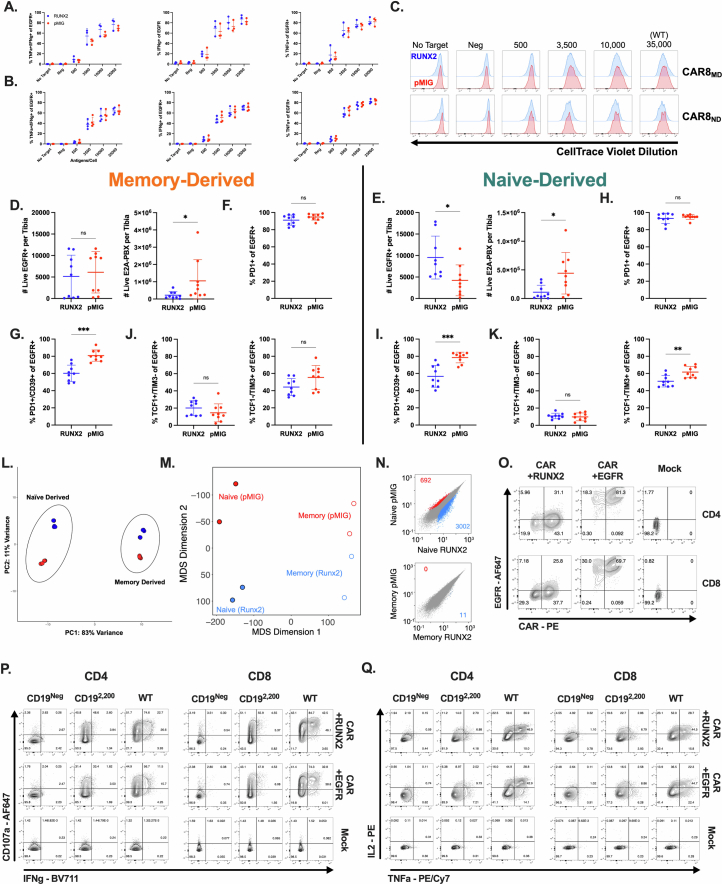
Extended Data Fig. 10. In vitro characterization, additional in vivo data, and additional genomic comparisons for RUNX2-overexpressing CAR8 (Related to Figs. 6 & 7).
Data are related to Figs. 6 and 7. Data in S10A-S10N are from murine CAR T cells. 10A-B: Quantification of intracellular cytokine staining of IFNγ and TNF after 6 hour co-culture assay, % positive of EGFR+, for memory (C) or naïve-derived (D) cells cotransduced with RUNX2 or pMIG. Data in S10-A-C are from 3-4 independent experiments. 10C: Proliferation as measured by dilution of CellTrace Violet dye dilution of EGFR+ cells after 72 hour co-culture assay, for memory or naïve derived cells co-transduced with RUNX2 or pMIG. Data representative of 3 independent experiments. All analyses in S10D-K are done on the same experiments described in Fig. 6. Counts data was generated by flushing a single tibia and using total tibia counts and cytometer proportions data to calculate CAR and leukemia cell counts per tibia. 10D-E: CAR and leukemia counts for RUNX2 overexpressing memory (D) (Exact p value: 0.0142) or naïve-derived (E) (Exact p values, left to right: 0.0106, 0.0188) CAR T cells compared to pMIG control. 10F-I: Proportions of EGFR+ cells from RUNX2 or pMIG CAR8 with the indicated phenotype. S10D,F,G are memory-derived cells, S10E,H,I are naïve-derived cells. 10F,H: PD1 + 10 G,I: PD1+/CD39+ (Exact p values, left to right: 0.0002, 0.0006) 10J-K: Indicated TCF1/TIM3 phenotype (Exact p value: 0.0036). Data in S9A-H are from one experiment with n = 5 mice per condition. Data in S10D-K are from 2 pooled, independent experiments with n = 9 mice per condition. 10L: PCA plot for RUNX2 and pMIG cells, both memory and naïve-derived groups, generated via variance stabilization transformation (vst) function from the R package DESeq2 and the removeBatchEffect function from the R package Limma to account for different collection dates. 10M: Inter-replicate Euclidian distance of voom-normalized ATAC-seq counts per peak between biological replicates, plotted using multidimensional scaling. 10N: Pairwise comparisons of differentially accessible chromatin regions within conditions between RUNX2 and pMIG CAR T cells in memory or naïve-derived groups. Data points are mean of voom-normalized ATAC-seq counts per peak between biological replicates of each group. Data in S10O-S10Q are from human CAR T cells. 10O: Co-staining of the h1928z CAR with EGFR in CD4+ or CD8+ cells co-transduced with hRUNX2-IRES-EGFR, EGFR (control) or Mock (untransduced). 10P: Degranulation as measured by CD107a expression and intracellular cytokine staining of IFNg after 5.5 hour co-culture assay. 10Q: Intracellular cytokine staining of IL-2 and TNF after 5.5 hour co-culture assay. Statistical comparisons for S10A-C were performed using Welch t-tests with Holm-Sidak correction for multiple comparisons of 2 groups. No statistically significant differences were found between RUNX2 engineered CAR T cells and pMIG control T cells for in vitro data. Statistical comparisons for data in S10D-K were performed using unpaired two-tailed t-test with or without Welch’s correction, or Mann-Whitney test. Data represent mean +/− SD. * p < 0.05, ** p < 0.01, *** p < 0.001, **** p < 0.0001.

