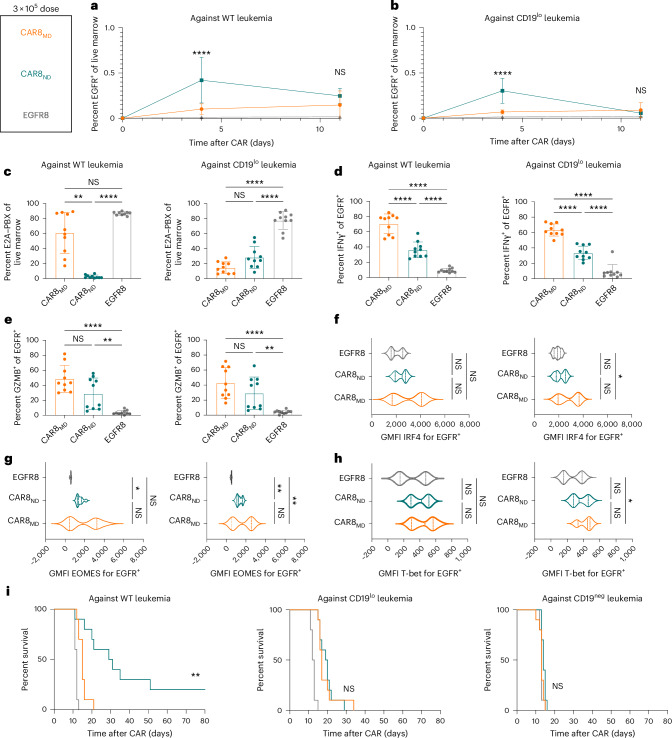
Fig. 3. CAR8ND T cells exhibit enhanced expansion capacity and clearance of WT leukemia in vivo.
Rag1−/− mice were injected with 1 × 10⁶ E2A–PBX1 leukemia cells on day −3, followed by 3 × 10⁵ OT-I CD8+EGFR+ T cells from the indicated T cell conditions on day 0. Bone marrow was analyzed by flow cytometry on day +4 or +11. The T cell populations isolated were CAR8MD T cells, CAR8ND T cells or EGFR control T cells (EGFR8). a,b, Early T cell expansion (day +4) or persistence (day +11) after infusion of transduced T cells against WT leukemia (a; exact P value of <0.0001) and CD19lo leukemia (b; exact P value of <0.0001). Transduced T cell populations were measured by coexpression of CD8a+TCRβ+EGFR+. c, Clearance of WT and CD19lo leukemia at day +11 after CAR infusion. E2A–PBX cells were measured by coexpression of B220+CD22+; exact P values from left to right: P = 0.0042, P < 0.0001, P < 0.0001 and P < 0.0001. d,e, Intracellular cytokine staining of IFNγ (d; exact P values: all <0.0001) or GZMB (e; exact P values from left to right: P < 0.0001, P = 0.0063, P < 0.0001 and P = 0.0034) in CAR T cells from whole bone marrow restimulated ex vivo with leukemia. Data are shown as mean ± s.d. f–h, Intranuclear TF staining of IRF4 (f; exact P value of 0.0287), EOMES (g; exact P values from left to right: P = 0.0133, P = 0.0058 and P = 0.0017) or T-bet (h; exact P value of 0.0150) on CAR+ T cells from mice bearing the indicated leukemia at day +4 after CAR infusion. Violin plot data represent median values with quartiles. i, Survival of mice after treatment with 1 × 10⁶ EGFR+ CAR or control T cells. Data are from two independent pooled experiments, with a total of n = 10 mice per condition; exact P value of 0.0012. Statistical comparisons were performed using a two-way ANOVA with Tukey’s multiple comparisons test (a and b), one-way Brown–Forsythe and Welch ANOVA with Dunnett’s T3 multiple comparisons test or Kruskal–Wallis nonparametric test with Dunn’s multiple comparisons test (c–h) or log-rank (Mantel–Cox) test for survival comparisons. Statistical comparisons were performed between CAR8MD and CAR8ND T cell groups when not otherwise specified; *P < 0.05, **P < 0.01, ***P < 0.001 and ****P < 0.0001.

