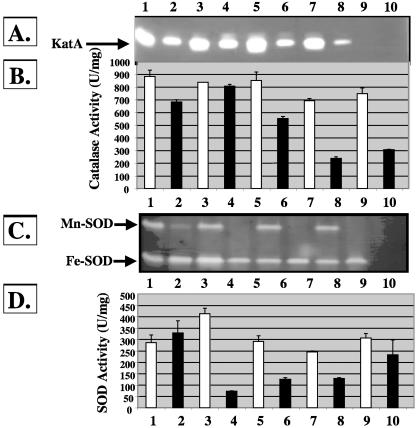
FIG. 2.
Effect of As(III) on catalase and SOD activity in P. aeruginosa. (A) Catalase isozyme activity stains based on 5 μg protein loaded per lane. Lane 1, wild-type PAO1; lane 2, PAO1 plus As(III); lane 3, arsB mutant; lane 4, arsB mutant plus As(III); lane 5, gor mutant; lane 6, gor mutant plus As(III); lane 7, crc mutant; lane 8, crc mutant plus As(III); lane 9, katA katB mutant; lane 10, katA katB mutant plus As(III). (B) Total catalase levels in cell extracts of wild-type and isogenic mutants that demonstrated sensitivity to As(III). Lane assignments are as in panel A except that: lane 9, sodA sodB mutant; lane 10, sodA sodB mutant plus As(III). (C) Nondenaturing gels stained for SOD activity gel based on 40 μg protein loaded per lane. Lane 1, wild-type PAO1; lane 2, PAO1 plus As(III); lane 3, arsB mutant; lane 4, arsB mutant plus As(III); lane 5, gor mutant; lane 6, gor mutant plus As(III); lane 7, crc mutant; lane 8, crc mutant plus As(III); lane 9, sodA sodB mutant; lane 10, sodA sodB mutant plus As(III). What appears to be a band in lane 10 is actually a notch cut in the gel to aid in the precise timing of electrophoresis. (D) Total SOD levels in cell extracts of wild-type and isogenic mutants that demonstrated sensitivity to As(III). Lane assignments are the same as in panel C except: lane 9, katA katB mutant; lane 10, katA katB mutant plus As(III). P values were obtained via Student's t test for PAO1 and the arsB, gor, crc, and sodA sodB mutants in the catalase activity assay, where activity of each strain is compared to that of the same strain that is As(III) treated, and are 0.35 × 10⁻⁵, 0.14 × 10⁻⁵, 0.023 × 10⁻⁵, 5.6 × 10⁻⁵, and 1.38 × 10⁻³, respectively. P values for PAO1 and the arsB, gor, crc, and katA katB mutants in the SOD assay are 0.61 × 10⁻⁴, 3.21 × 10⁻⁴, 6.01 × 10⁻³, 9.86 × 10⁻⁵, and 0.43, respectively.

