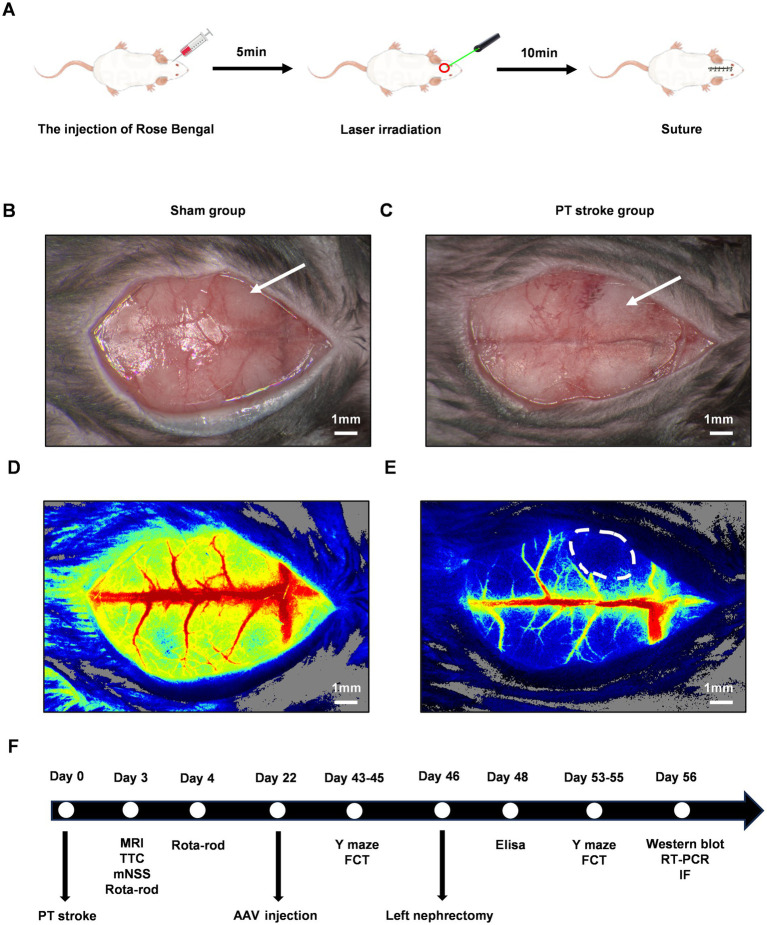
Figure 1.
The experimental design and the verification of the cerebellar infarct region following PT stroke. The schematic diagrams of PT stroke for focal ischemic stroke model in mice were shown in (A). The gross pictures after the PT stroke were shown for the sham group (B) and the PT group (C). The white arrow indicated the target infarct site. (D,E) Were the pseudo-color maps of ischemic regions following PT stroke in the sham group and PT group, respectively. The white dot circled area indicated the ischemic lesion. Scale bars represented 1 mm. A Schematic of the entire experimental timeline is shown in (F). PT, photothrombotic; MRI, magnetic resonance imaging; TTC, 2,3,5-Triphenyltetrazolium chloride; mNSS, modified neurological severity score; AAV, adeno-associated virus; FCT, fear conditioning test; RT-PCR, reverse transcription polymerase chain reaction; IF, immunofluorescence staining.

