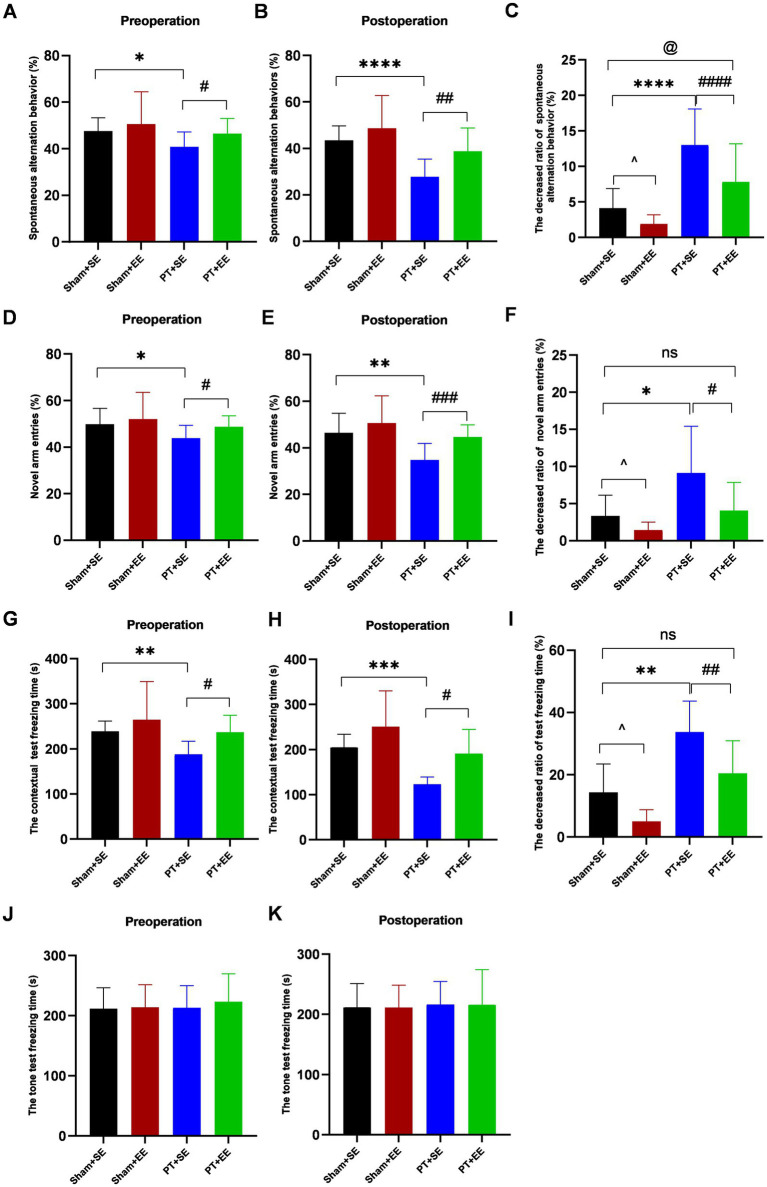
Figure 3.
The results of behavioral tests before and after surgery in mice with ischemic stroke. (A–C) The percentage of spontaneous alteration in the Y maze test (n = 12). (D–F) The percentage of novel arm entries in the Y maze test (n = 12). (G–I) The freezing time in contextual test (n = 6). (J–K) The freezing time in tone test (n = 6). ns: no significant; *p < 0.05, **p < 0.01, ***p < 0.001, ****p < 0.0001, the Sham+SE group vs. the PT + SE group; #p < 0.05, ##p < 0.01, ###p < 0.001, the PT + SE group vs. the PT + EE group; ^p < 0.05, the Sham+SE group vs. the Sham+EE group; @p < 0.05, Sham+SE group vs. the PT + EE group. Error bars were represented as mean ± SD.

