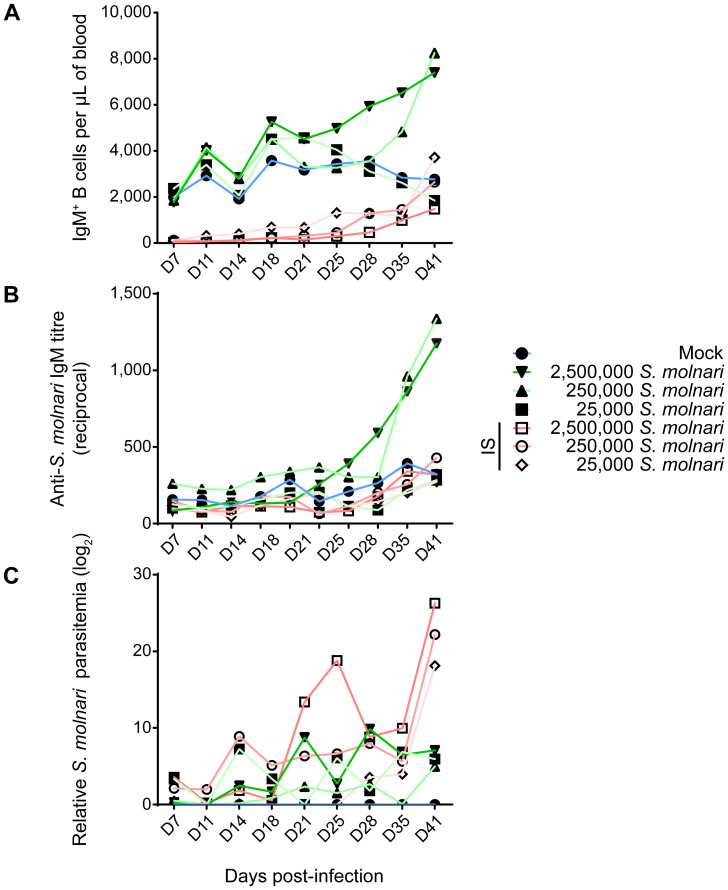
Figure 2.
Infected common carp produce S. molnari-specific IgM which may limit parasitemia. By measuring (A) the concentration of peripheral blood IgM+ B cells, (B) anti-S. molnari IgM antibody titres, and (C) parasitemia, we followed the progression of S. molnari infection in each of 6 groups of infected fish and one control group, represented by different line colors and symbols (legend on the right). We collected samples and took measurements at the indicated timepoints ranging from 7 to 41 days post-infection (x-axes, D7 to D41). Filled or hollow symbols represent mean measurements from fish that were healthy or immunosuppressed (IS) respectively, at the time of infection; different shades of green or red as well as symbols represent different doses of S. molnari used in laboratory infection; the control mock-infected group is represented by blue lines. (A) Through the strategy depicted in Figure 1 , we quantified the concentration of IgM+ B cells throughout the experiment. (B) The unit of measurement presented on the y-axis is reciprocal antibody titre, such that a higher number reflects a higher anti-S. molnari titre. (C) Parasitemia data was logarithmically transformed and presented in logarithmic units (base 2). n ≥ 5 biological replicates per timepoint per group. Please, refer to Supplementary Figure S1 for the statistical analyses.

