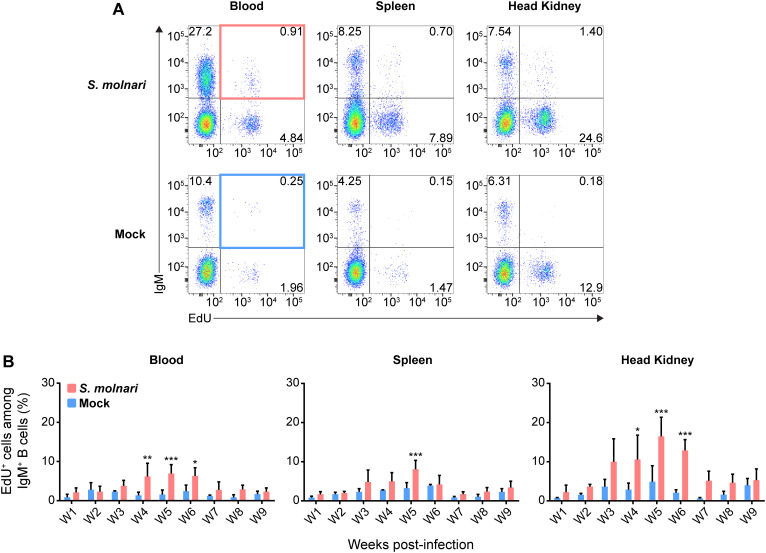
Figure 3.
Common carp IgM+ B cells proliferate in the blood, the splenic lymphoid organ, and the head kidney lymphoid organ following S. molnari infection. (A) We exposed fish to the thymidine analogue (EdU) at different time points throughout S. molnari infection or in non-infected fish (Mock). As an indicator of proliferation, IgM+ B cells that incorporated EdU were identified by flow cytometry by adapting the gating strategy presented in Figure 1A to detect EdU+ cells in different tissue compartments. Representative plots from week 5 of the infection are presented here, organized by compartment (columns) and fish status (rows). The top two quadrants in every plot are the IgM+ B cell populations of interest. In the first column, the top right quadrants are marked by red or blue quadrilaterals which are the gates we used to quantify IgM+ EdU+ B cells from S. molnari-infected or control fish, respectively. (B) The proportion of IgM+ EdU+ B cells among total IgM+ B cells was quantified throughout the infection and summarized in bar graphs. Each bar extends to the mean with SD error bars. n = 3 or n = 4 biological replicates per timepoint for the Mock and S. molnari groups, respectively. ns (not significant); * p < 0.05; ** p < 0.01; *** p < 0.001.

