Figure 4.
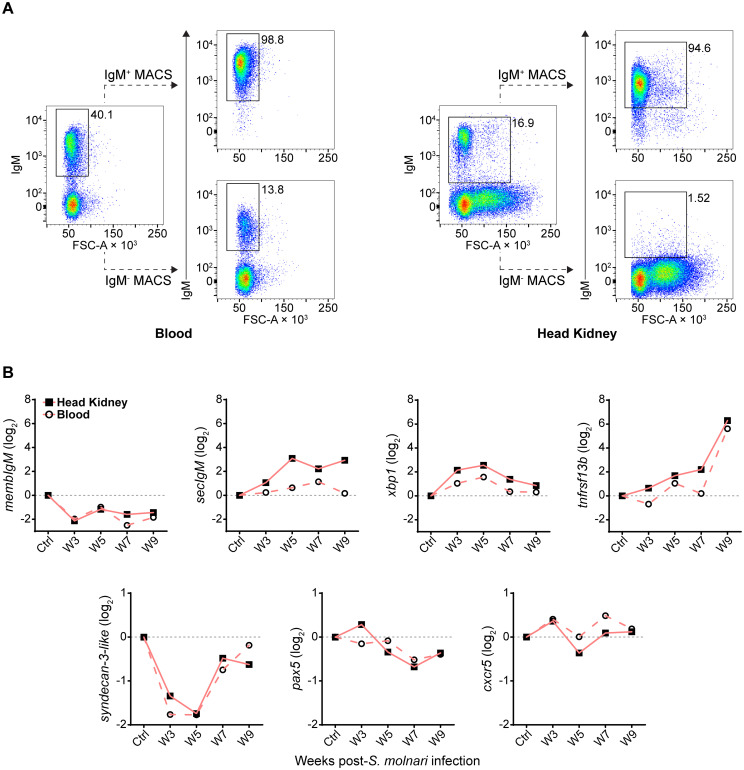
Following S. molnari infection, common carp IgM+ B cells express markers of B cell activation and differentiation in the blood and head kidney. (A) Head kidney or blood IgM+ B cells were MACS-sorted using the monoclonal anti-carp IgM antibody WCI12. Here are two representative MACS results for the blood (left) and the head kidney (right). In each plot, the proportion of IgM+ B cells is adjacent to the corresponding flow cytometry gate. The dashed lines point to the result of MACS: either the eluted IgM+ fraction (IgM+ MACS) or the unbound/washed negative fraction (IgM- MACS). All plots depict the mean fluorescence intensity of WCI12 staining (y-axes) versus forward scatter area (FSC-A, x-axes). (B) RNA from MACS-enriched IgM+ B cells was used to quantify expression of select markers of activation and differentiation throughout S. molnari infection. Logarithmically transformed (base 2) relative expression (2−ΔΔCT method) of each marker (y-axes titles) is presented in each plot and organized by highly or weakly differentially expressed genes: respectively, markers in the top row (over 2-log maximum change) or bottom row (under 2-log change). The control group (Ctrl) includes data collected from fish sampled prior to infection. We plotted the mean of relative expression of each group at each timepoint represented by either filled squares connected by lines (head kidney compartment) or hollow circles connected by dashed lines (blood compartment). n ≥ 4 biological replicates per group per timepoint. Please refer to Supplementary Figure S2 for statistical analyses.

