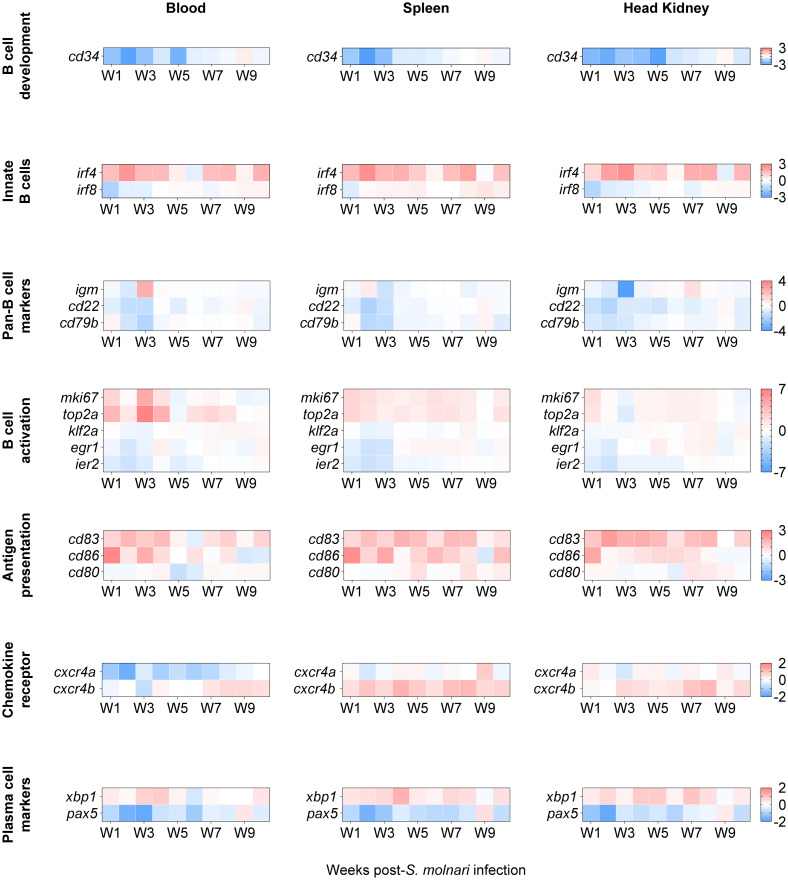
Figure 5.
The transcription profile of cyprinid markers of developing, innate, activated/proliferating, antigen-presenting, and differentiated IgM+ B cell subpopulations. We profiled expression of markers defining distinct B cell subpopulations, i.e. genes initially identified in single-cell RNA sequencing analysis of grass carp IgM+ B cells (16). Here, genes were categorized (in separate rows of heat maps) based on the subpopulations they cluster, by developmental stage, and/or by activities such as activation and antigen presentation. The two-color gradient represents either overexpression or downregulation relative to the control group (not shown here). The legends for each gene category are on the rightmost side of each set of heat maps. Data in absolute number of copies of each gene were normalized to the number of copies detected in the control group and then logarithmically transformed (base 2) to better reflect both positive and negative fold changes. n ≥ 4 biological replicates per gene per timepoint. For statistical analyses, please refer to Supplementary Figure S4 .

