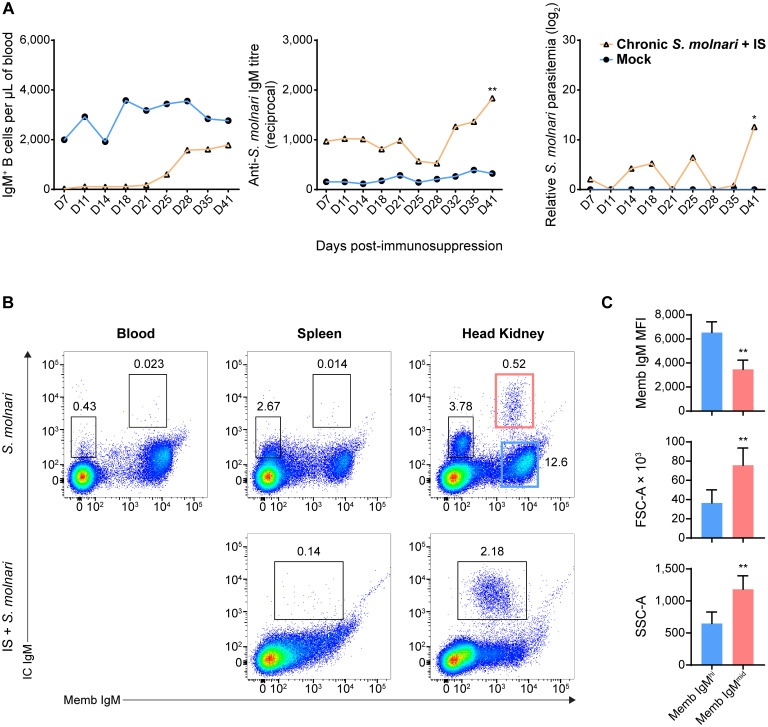
Figure 7.
A population of head kidney-specific large B cells with exceptionally high levels of intracellular IgM and resistance to immunosuppression may represent plasma cells of the common carp. (A) We studied a cohort of immunocompetent carp infected eight months prior which have not achieved sterile immunity (labeled ‘Chronic S. molnari’). Unlike fish infected for the first time ( Figure 1 , the ‘Mock’ control group was sampled simultaneously as the ‘Chronic S. molnari’ group), these carp constitutively produced anti-S. molnari IgM (middle plot) which are conventionally produced by plasma cells. As we hypothesized that plasma cells are resistant to immunosuppression, the ‘Chronic S. molnari’ cohort of fish was treated with triamcinolone acetonide (IS) which did not decrease specific antibody titres throughout the experiment despite completely depleting circulating IgM+ B cells (left plot). Nonetheless, parasitemia (right plot) was measurable in these fish. Orange line and triangle symbols represent the ‘Chronic S. molnari + IS’ group whereas the blue line and circles represent an uninfected control cohort mock-infected (Mock). We performed immunosuppression on day 0 and thus the x-axis represents the days post-immunosuppression or -mock injection. (B) We identified a population of putative plasma cells via costaining for membrane/cell surface IgM (memb IgM, x-axes) and intracellular IgM (IC IgM, y-axes) lymphocytes. This IC IgMhigh population was detectable exclusively in the head kidney (rightmost column). Despite near-complete depletion of IgM+ B cells in the blood ( Figures 1B , 2A ), and head kidney, triamcinolone acetonide treatment (IS) enriched this IC IgMhigh population in the head kidney (bottom right plot). (C) Each bar indicates the mean of either the mean fluorescence intensity (MFI) of membrane IgM staining, forward scatter area (FSC-A), or side scatter area (SSC-A) + SD. For these metrics, statistically significant differences between the memb IgMhigh and memb IgMmid populations, respectively outlined in blue and red rectangles in (B), were determined by the Wilcoxon signed rank test with the two populations as matched pairs in n = 8 biological replicates. * p < 0.05; ** p < 0.01.

