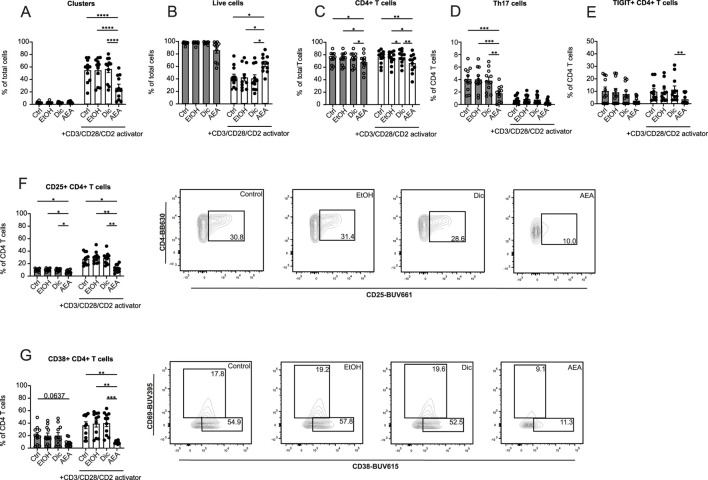
FIGURE 5.
AEA dramatically alters the proliferation, activation and exhaustion profiles of CD4+ T cells. Human isolated T cells were pre-treated with ethanol (EtOH), Diclofenac and EtOH (Dic), and AEA (10 µM) with Diclofenac (AEA), and were activated or remained inactivated for up to 6 days. Cells were measured by flow cytometry. Percentage of cell clusters (A), live cells (B), CD4+ T cells (C), Th17 cells (D), TIGIT+CD4+ T cells (E), CD25+ CD4+ T cells (F), and CD38+CD4+ T cells (G) are shown. Data are from three independent experiments, with at least 3 donors each. Each data point corresponds to a single donor (n = 11). Data are shown as mean SEM. *p < 0.05, **p < 0.01, ***p < 0.001, ****p < 0.0001; p-values were calculated using two-way ANOVA with Tukey correction.

