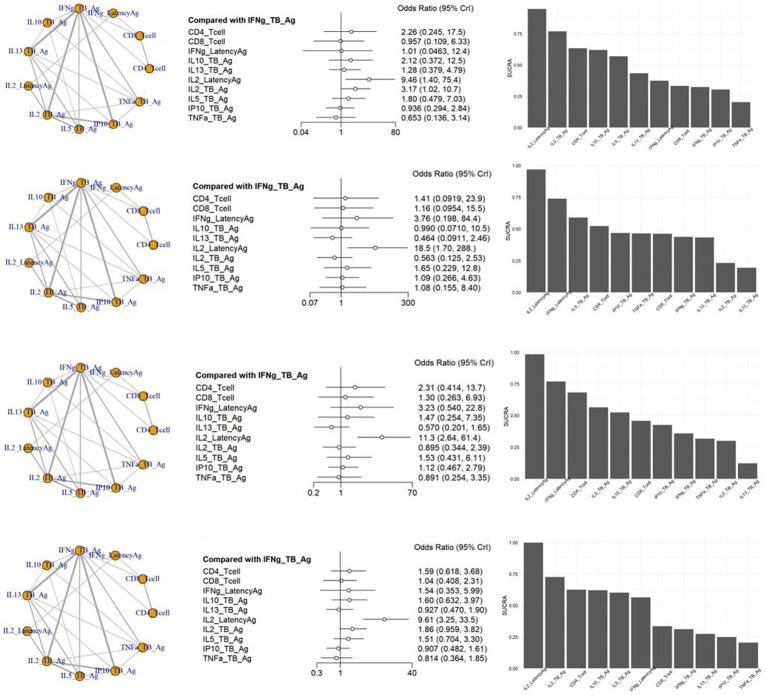
Figure 4.
Schematic diagram of the network of evidence used in network meta-analysis, forest plots and surface under the cumulative ranking area (SCURA) in (A) sensitivity, (B) specificity, (C) positive predictive value (PPV) and (D) negative predictive value (NPV) of various markers for differentiating TB from LTBI.

