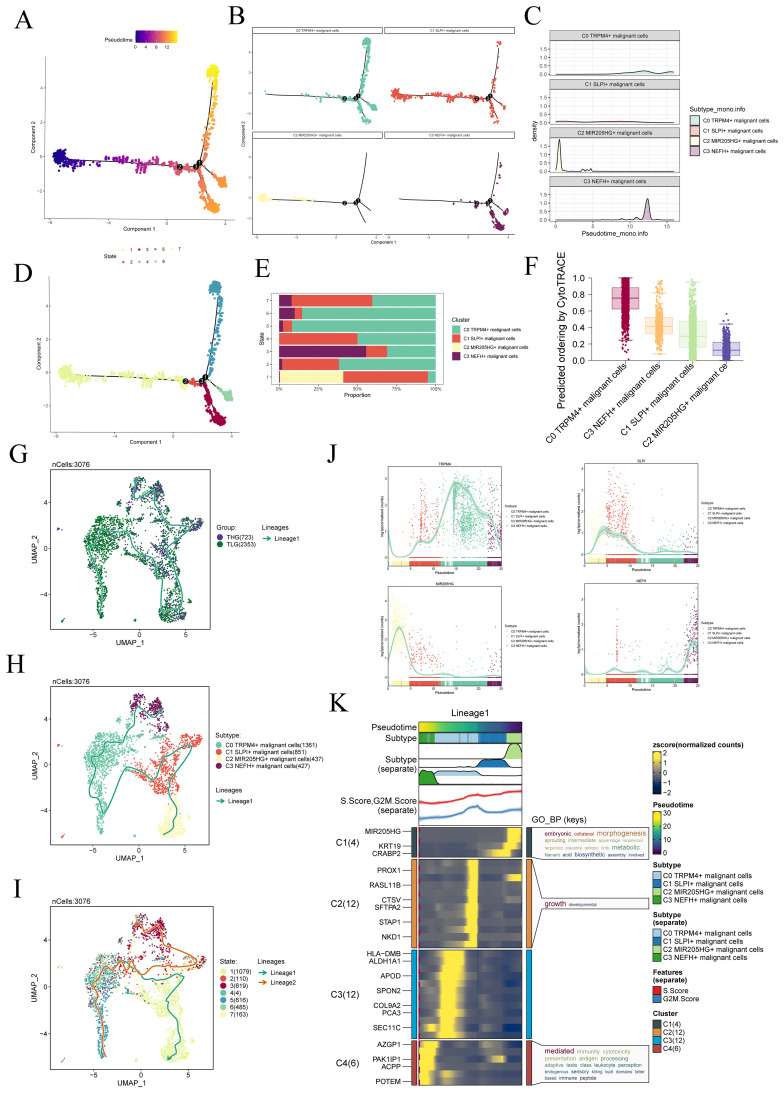
Figure 4.
Slingshot analysis of malignant cell subtypes. (A) The Monocle analysis was utilized to infer the developmental trajectory of malignant cells. (B) Cells were colored based on pseudotime and visualized to show the position of different cell types along the developmental trajectory. (C) The ridge plot depicted the dynamic changes in the cell state of different cell subtypes. (D, E) The pseudotime was divided into seven-time states (States 1-7) based on the time order, and the slingshot analysis inferred the differentiation trajectories of different cell subtypes at each time stage. The stacked bar graph showed the proportions of cell subtypes in each of the seven-time stages. (F) The Cytotrace analysis was employed to rank the stemness of malignant cell subtypes. (G–I) The UMAP plots displayed the slingshot differentiation trajectories of different malignant cell subtypes, different tissue types, and different time stages. The solid lines represented the differentiation trajectories, and the arrows indicated the direction of differentiation (from naive to mature). (J) Differential expression patterns of marker genes for four malignant cell subtypes during the differentiation process. (K) The GO-BP enrichment analysis confirmed the biological processes corresponding to the pseudotime trajectory of malignant cell subtypes.

