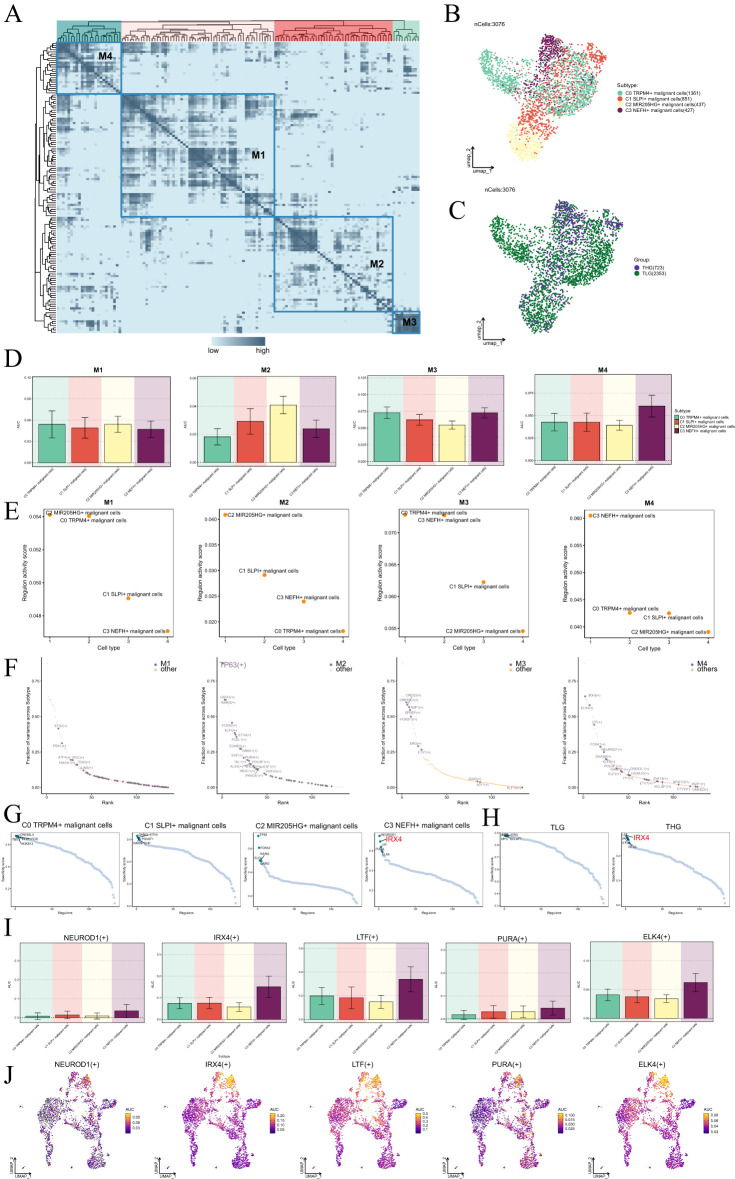
Figure 6.
Identification of gene regulatory networks in C3 NEFH+ malignant cells. (A) Heatmap displayed the identification of four regulatory modules in malignant cell subtypes based on SCENIC regulatory rule modules and AUCell similarity scores. (B, C) UMAP plots colored and visualized all malignant cells based on the activity scores of regulatory modules, respectively, according to cell subtypes and tissue types. (D) Bar graphs provided a visual comparison of the AUC values of TFs in each module across different malignant cell subtypes. (E) Scatter plots displayed the regulatory activity of TFs in each module across different malignant cell subtypes. (F) Scatter plot displayed the ranking of TFs based on the fraction of variance across subtype in each module. (G, H) Rank the regulatory factors of different malignant cell subtypes and tissue types based on the regulatory specificity score. (I, J) Bar graphs depicted the AUC value of the top five TFs in C3 NEFH+ malignant cells across different malignant cell subtypes. UMAP plots visualized the distribution of these TFs.

