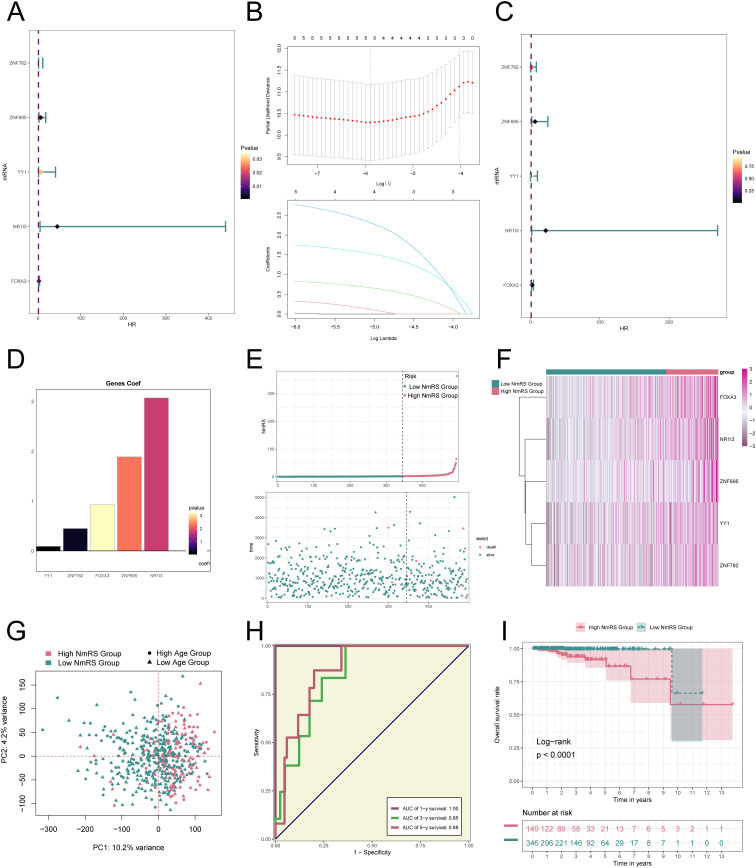
Figure 8.
Construction and validation of the NEFH+ malignant cells risk score (NmRS) model. (A) Forest plot of univariate Cox regression analysis showed genes with significant differences (HR<1: protective factors, HR>1: risk factors). (B) LASSO regression analysis identified five prognostic-related genes (non-zero regression coefficients). The optimal parameter was determined through cross-validation (upper plot), and the LASSO coefficient curve was determined using the optimal lambda (lower plot). (C) Forest plot displayed the results of multivariate Cox regression analysis. (D) Bar graph showed the Coef values of the genes used for model construction. (E) Curve plot displayed the risk scores of the high NmRS group and low NmRS group (upper plot), and scatter plot showed the survival/death events over time in the two groups (lower plot). (F) Heatmap displayed the differential expression of model genes, with color scale based on normalized data. (G) Scatter plot showed the distribution of genes along PC1 and PC2 in the high NmRS group and low NmRS group. (H) Sensitivity and specificity of 1-year, 3-year, and 5-year outcomes were evaluated using ROC curves and AUC values. (I) Kaplan-Meier curves displayed the survival differences between the high NmRS group and low NmRS group.

