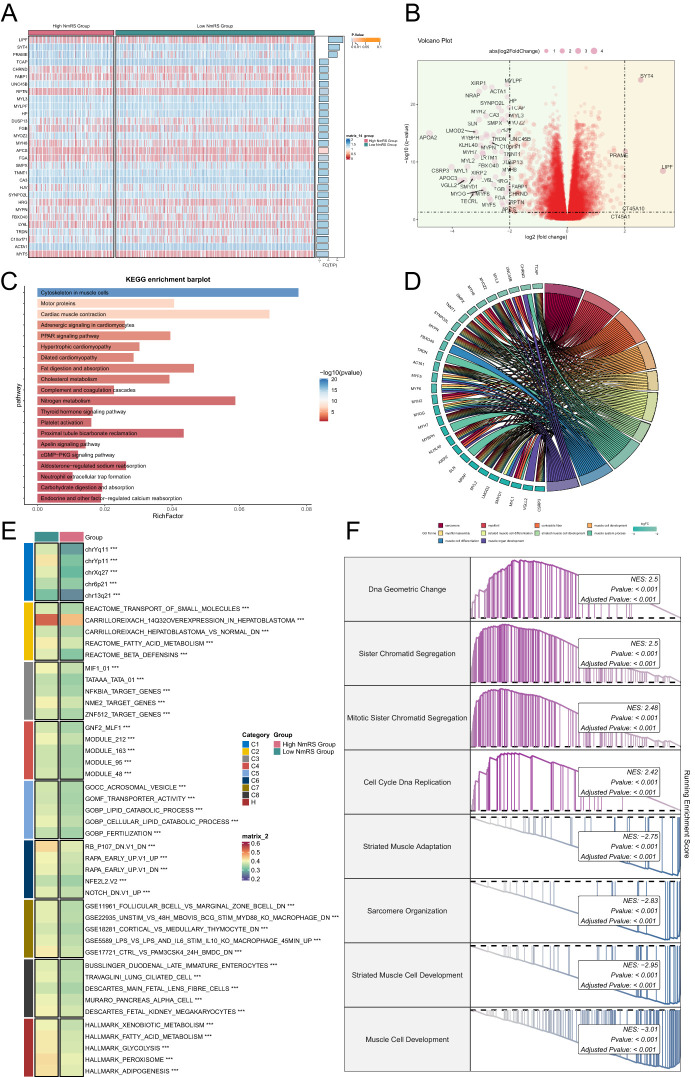
Figure 9.
Enrichment analysis of DEGs and GSVA analysis results. (A) Heatmap displayed the expression of the top 30 DEGs in the high and low NmRS groups. (B) Volcano plot showed the upregulated and downregulated DEGs in the high and low NmRS groups. (C) Bar graph displayed the results of KEGG pathway enrichment analysis of DEGs in the high and low NmRS groups. (D) Chord plot displayed the results of GO enrichment analysis of DEGs in the high and low NmRS groups. (E) Heatmap illustrated the results of GSVA enrichment analysis of DEGs in the high and low NmRS groups. (F) Detailed description provided GSEA enrichment results for DEGs in different pathways. ***P < 0.001.

