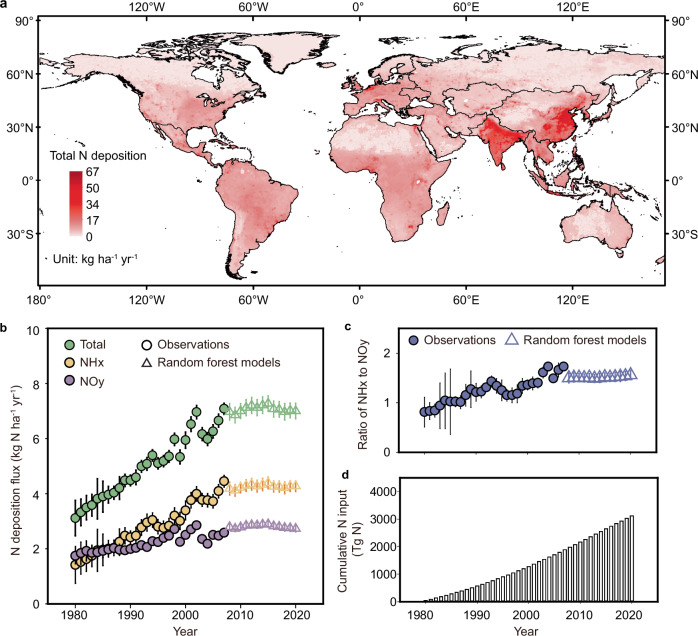
Fig. 1. Spatio–temporal patterns of global terrestrial N deposition.
a Spatial distribution of total N deposition in 2020. b Temporal dynamics of total, NHx, and NOy deposition from 1980 to 2020; the circles are direct observations and their error bars indicate SE (the variation among the monitoring sites); the triangles are estimated from random forest models and their error bars indicate SE (variations across three random forest models). Different colors represent different N deposition components. c Temporal dynamics of ratio of NHx to NOy deposition from 1980 to 2020. d Cumulative N deposition input from 1980 to 2020. Note: The Antarctic is not included. Source data are provided as a Source Data file.

