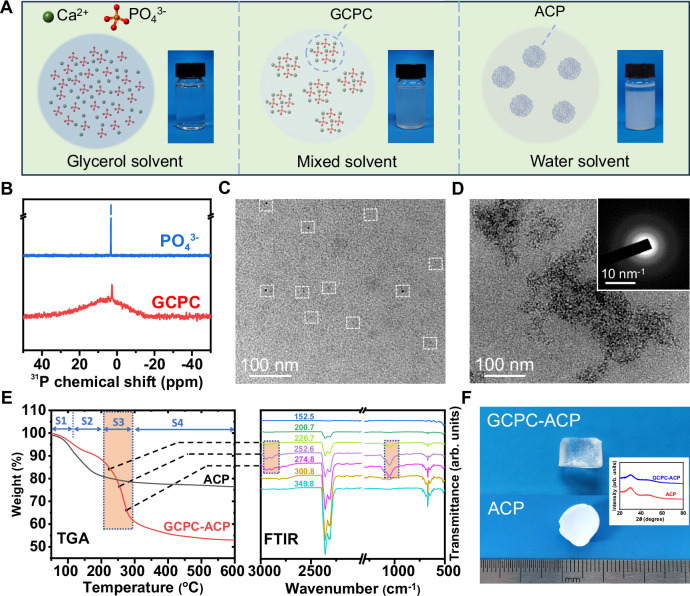
Fig. 1. Synthesis and characterization of GCPC.
A Schematic and digital images of the prepared solutions by adding the same concentration of PO43−/ Ca2+ (0.033 and 0.050 mol/L, respectively) in different solvents (glycerol, mixed (glycerol + water, water content 16.7 v/v%) and water solvents). B 31P NMR spectra of the solutions containing PO43− ions or PO43−/ Ca2+ ions in the glycerol-dominant solvent (deuterated water: 16.7 v/v%; glycerol and other chemicals are not deuterated). C Liquid cell TEM image of GCPC in the solution of glycerol-dominant solvent (water content 16.7 v/v%). White dashed squares highlight the GCPCs on the image. D TEM image of GCPC-ACP formed by adding GCPC into a large amount of ethanol. Inset: SAED pattern. E TGA-FTIR analysis of ACP and GCPC-ACP where FTIR spectra (right) of the gas released during heating the sample for TGA (left) is collected simultaneously. The TGA curve of GCPC-ACP displays four stages (labeled as S1-S4). The selected FTIR spectra (recorded at 226.7–274.8 °C as indicated on each spectrum) of S3 show characteristic bands at 2948, 2894 and 1054 cm−1 marked with rectangles, indicating that this stage corresponds to the loss of glycerol. Therefore, the contents of water and glycerol are calculated to be 8.37 wt% and 27.4 wt%, respectively. F Digital images of dried GCPC-ACP (top) and normal ACP (bottom) prepared in water displaying a high transparency and an opaque white, respectively. Inset: XRD spectra revealing the amorphous phases of GCPC-ACP and ACP.

