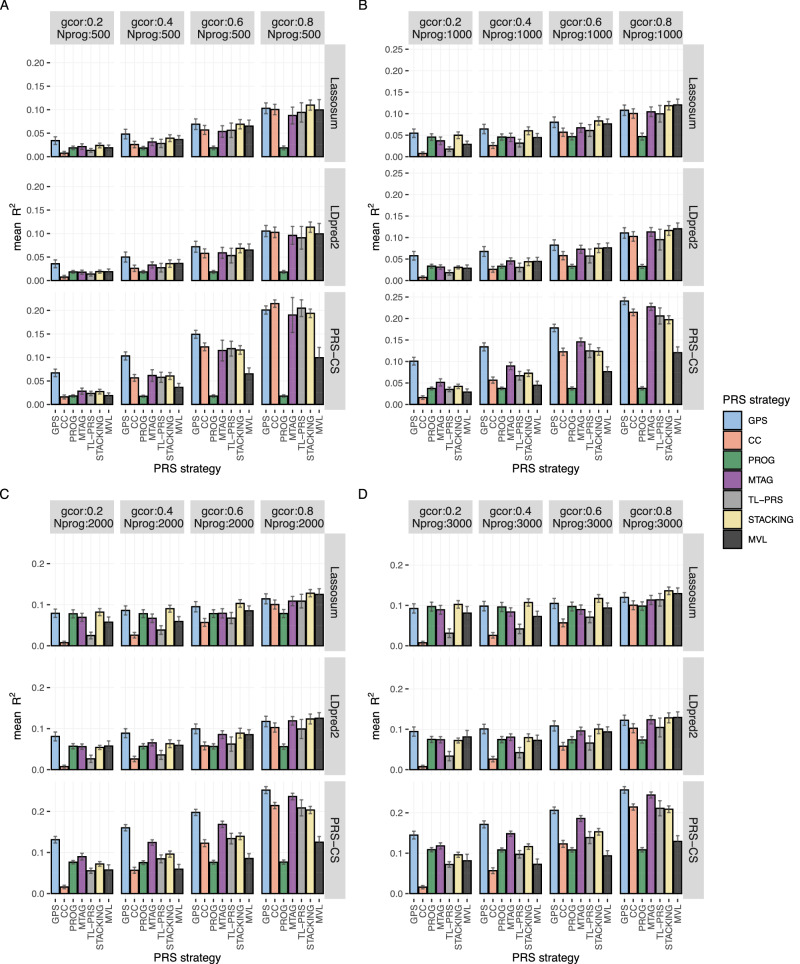
Fig. 2. Prediction accuracy of different PRS models in simulations (200 causal variants).
All causal variants are shared between progression and case-control phenotypes in this simulation. The prediction accuracy is evaluated by the mean prediction across 20 simulated replicates. The error bar indicates the standard deviation of prediction across 20 simulation replicates. Each row represents different PRS models using the same baseline PRS method. MVL uses Lassosum as baseline framework, so it cannot accommodate alternative baseline PRS methods. To facilitate comparisons, we estimate the prediction of MVL by repeating across the scenarios in different rows and taking the average. The sample size of the progression cohort is 500 in (A), 1000 in (B), 2000 in (C), and 3000 in (D). The number of causal variants is set as 200. gcor genetic correlation, Nprog sample size of biobank study of progression phenotype. Super-stacking models are not included here but are shown in Supplementary Fig. 3. Scenarios with different causal variants between case-control and progression phenotypes are given in Supplementary Fig. 1.

