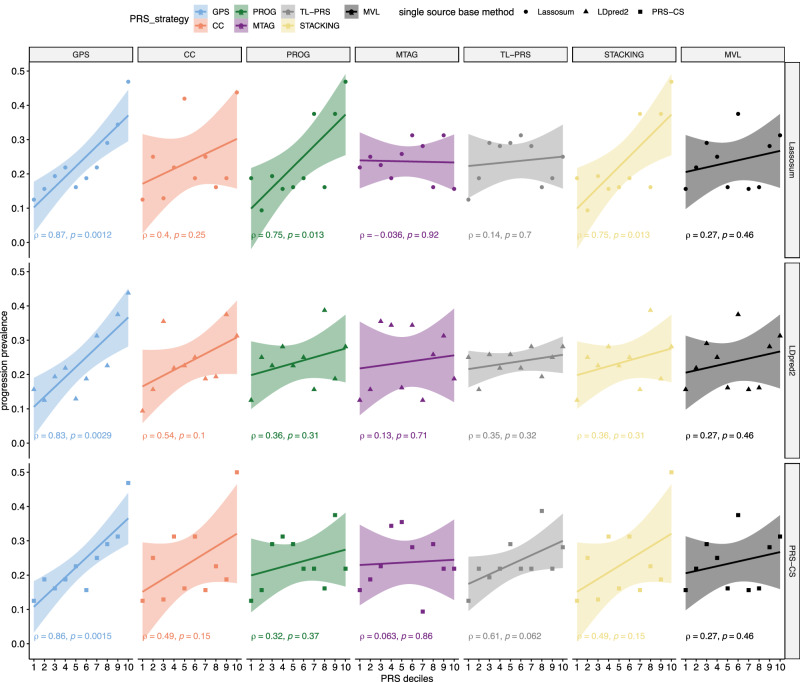
Fig. 3. The association between PRS and the prevalence of RF positive → RA progressions in the All of Us data.
The All of Us data is not used to train genetic risk scores. The Pearson correlation coefficient (and corresponding p-values from two-sided t-test) between PRS and the progression prevalence at each decile in the All of Us data are labeled on the plot. The error bands represent 95% confidence intervals of fitted linear regression lines. MVL uses Lassosum as baseline framework. The prediction accuracy of MVL is obtained by repeating across the scenarios of different rows and taking the average. It is clear that GPS consistently yields stronger and more significant correlations between predicted and observed progression in the independent test dataset, which demonstrates improved accuracy. Super-stacking models are shown in Supplementary Fig. 5.

