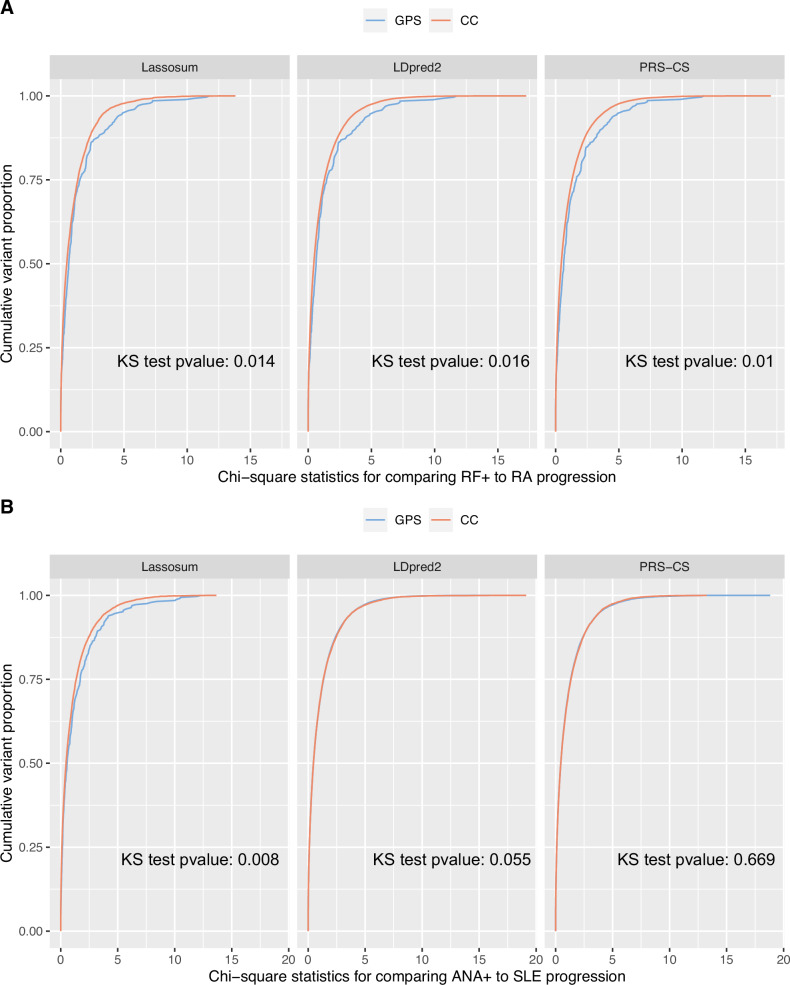
Fig. 5. Cumulative distributions of marginal association statistics testing the association with preclinical to disease progressions in the All of Us dataset.
We trained the progression risk scores in the BioVU biobank. We also performed GWAS, comparing preclinical to disease cases, in the All of Us data, which is not used in model training. For variants selected by GPS or the risk scores using CC samples only, we compare the distribution of the marginal statistics testing genetic associations with preclinical → disease progression. The cumulative distribution functions of the marginal statistics are plotted for A RF positive to RA progressions and B ANA positive to SLE progressions, for the variants selected by the risk scores. Two-sided Kolmogorov-Smirnov (KS) tests were performed to compare the distributions and the p-values are labeled on each subpanel. At each quantile, the variants selected by GPS are often more significantly associated with the progression phenotype compared to variants selected by risk scores based on CC studies. This comparison explains why GPS is more accurate for predicting preclinical to disease progressions. Cumulative distributions of marginal association statistics contrasting healthy control with preclinical disease are given in Supplementary Fig. 7.

