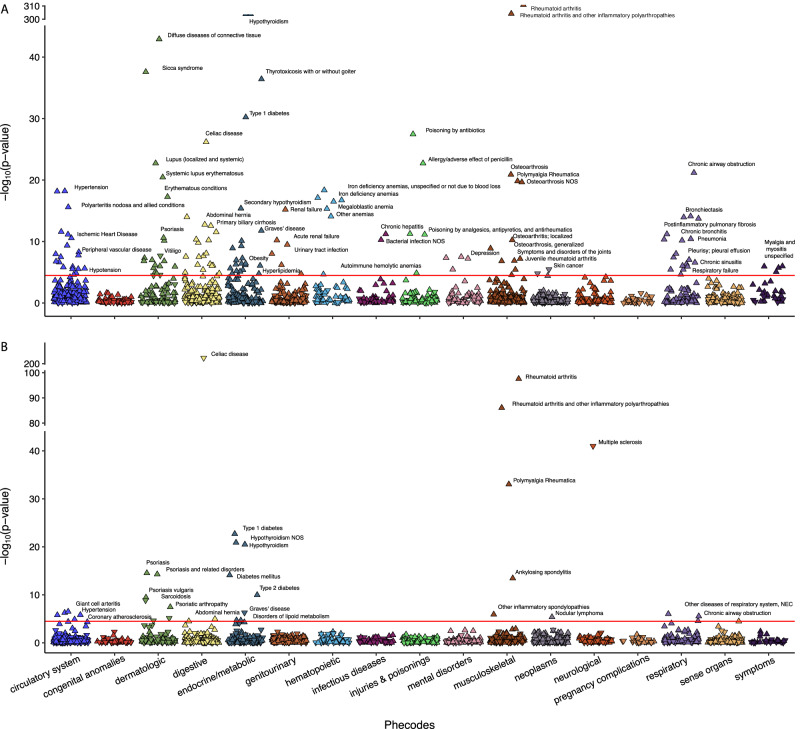
Fig. 6. PheWAS results for RA case-control and progression risk scores in UK Biobank.
A PheWAS results from CC-PRS of RA. B PheWAS results from GPS-PRS of RA. The y-axis represents the −log10(p-value) for each PheWAS code, derived using a two-sided Chi-square test after fitting a multivariate logistic regression model. The x-axis displays different PheWAS code categories. Each point corresponds to a specific PheWAS code, with downward and upward pointing triangles indicating negative and positive associations between disease status defined by the PheWAS code and the PRS, respectively.

