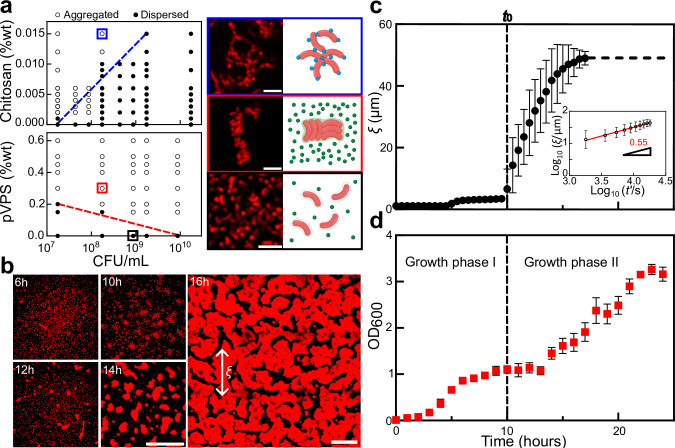
Fig. 1. VPS is not attractive to Vc cells.
a Left: Phase diagrams were generated by mixing non-VPS-producing cells and polymers at the indicated concentrations and visually scoring the cultures as either aggregated (open circles) or dispersed (filled circles) after 6 h. Right: Representative images were collected 6 h after mixing non-matrix-producing Vc cells and polymers (from top to bottom: chitosan, purified VPS, and control without any polymer), at z = 4 µm above the glass surface. Shown on the right is the schematic for each configuration created with BioRender.com. pVPS stands for purified VPS. Cells constitutively express mRuby3. Scale bars = 5 µm. Colors correspond to the two aggregation mechanisms (blue for bridging-aggregation and red for depletion-aggregation, respectively). %wt = weight percent. b Cross-sectional confocal images (at z = 4 µm above the glass surface) during the growth of a culture from a VPS-producing strain (ΔrbmAΔbap1ΔrbmC or ΔABC in short). Cell membranes were stained with FM 4-64 (2 µg/mL). ξ indicates the characteristic size of the cell clusters. Scale bars = 50 µm. c Evolution of averaged ξ versus time t in cultures of VPS-producing cells (images taken at z = 4 µm above the glass surface). Inset: Normalized ξ versus rescaled time on log scale. t0 (indicated by the dashed line) corresponds to the onset of the spontaneous aggregation. d Growth curve of the ΔABC culture. All data are shown as mean ± SD (n = 4 biological replicates). Aggregates were disassembled via vortexing before each OD600 measurement. Source data are provided as a Source Data file.

