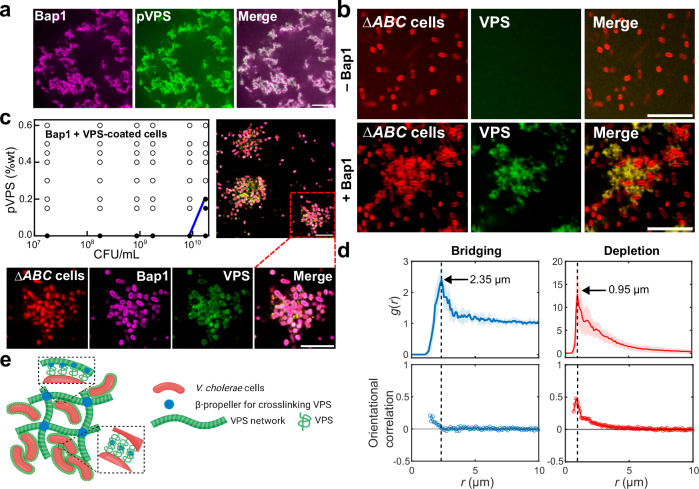
Fig. 3. Crosslinking of VPS by Bap1 leads to bridging-aggregation.
a Cross-sectional images from a mixture of Bap1-GFP at 1.2 mg/mL (pseudocolored in magenta) and pVPS at 0.6 mg/mL stained with wheat germ agglutinin (WGA) conjugated to AlexaFluor647 (pseudocolored in green). Representative images were shown from four repeated experiments. b Cross-sectional images of ΔABC culture after 8 hours of growth, with or without 1 mg/mL Bap1 (images taken at z = 4 µm above the glass surface). Cell membranes were stained with FM 4-64 (red). Representative images were shown from four repeated experiments. c Upper left: Phase diagram generated by mixing Bap1 with ΔABC cells constitutively expressing mRuby3 fixed in growth phase I, at the indicated concentrations and visually scoring the cultures as either dispersed (filled circles) or aggregated (open circles). Blue solid line corresponds to the phase boundary. Upper right: Cross-sectional images showing aggregates of ΔABC cells bridged by exogenously added Bap1 (at z = 9.35 µm above the glass surface). Bottom: Zoomed-in images showing the localization of ΔABC cells constitutively expressing mRuby3 (red); GFP-labeled Bap1 (pseudocolored in magenta); VPS polymers stained with WGA-647 (pseudocolored in green); and overlaid image showing the colocalization of Bap1 and VPS surrounding each cell. Scale bars = 10 µm. d Top: Radial distribution function of cell centroids, for the bridging case corresponding to experiment in (c) (left) and the depletion case corresponding to 5Δ cells plus purified VPS (right). Data are presented as mean values from measurements taken from distinct samples ± SD (shade around the solid line). Bottom: Orientational correlation as a function of distance between the cell centroids, r. Orientational correlation is defined as , in which corresponds to the angle between the orientations of cells i and j and the angle bracket denotes the average over all cell pairs at a cell-to-cell distance r. Cell centroids and orientations were obtained by single-cell segmentation. Data are presented as mean values from measurements taken from distinct samples. e Schematic of how Vc cells form biofilms via cell-VPS and cell-cell interaction mediated by crosslinking, created using BioRender.com. Source data are provided as a Source Data file.

