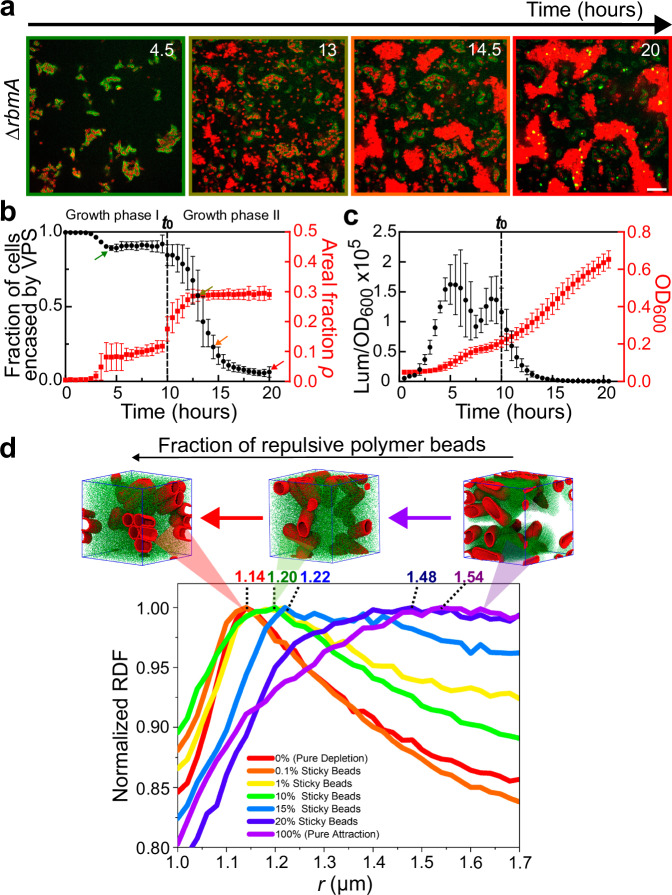
Fig. 4. Quantification of VPS production during biofilm growth.
a Time-course of growth from 4.5 to 20 hours of a biofilm formed by the ∆rbmA strain (images shown at z = 4 µm above the glass surface). Cell membranes were stained with FM 4-64 (red) and VPS was stained with WGA conjugated to Oregon Green (green). Note at the late stage, some dead cells with exposed cell walls were also stained with WGA. Scale bars = 10 µm. b Quantification of the fraction of cells encased by VPS (black circle) and the total cell density approximated as the areal fraction ρ in the imaging plane (red square) during 20 hours of the growth of ΔrbmA biofilms. The color of the image border in (a) corresponds to the time points highlighted by arrows of the corresponding colors in (b). Data are presented as mean values ± SD (n = 5 biological replicates). c Quantification of vpsL gene expression in ΔrbmA biofilms through the measurement of luminescence from the pBBRlux-vpsL reporter, normalized by OD600. Data are presented as mean ± SD (n = 4 biological replicates). d Simulation results with a variable fraction of polymer beads that are repulsive to each other and to the cell surface. The simulation box (6.2 × 6.2 × 6.2 µm3) contains 80,000 polymer beads and 12 cells. When the polymer beads are all attractive to each other and to the cell surface (magenta), a broad peak with a peak position away from close contacts is observed, consistent with the experimental RDF in the bridging case. As the fraction of repulsive polymer beads increases, the peak becomes sharper and the peak position shifts to shorter cell-cell distances, and eventually reduces to the pure depletion case (red). Shown on top of the curves are corresponding simulation snapshots, in which cells are shown in red and polymer beads in green. See Supplementary Table S2 for simulation parameters. Source data are provided as a Source Data file.

