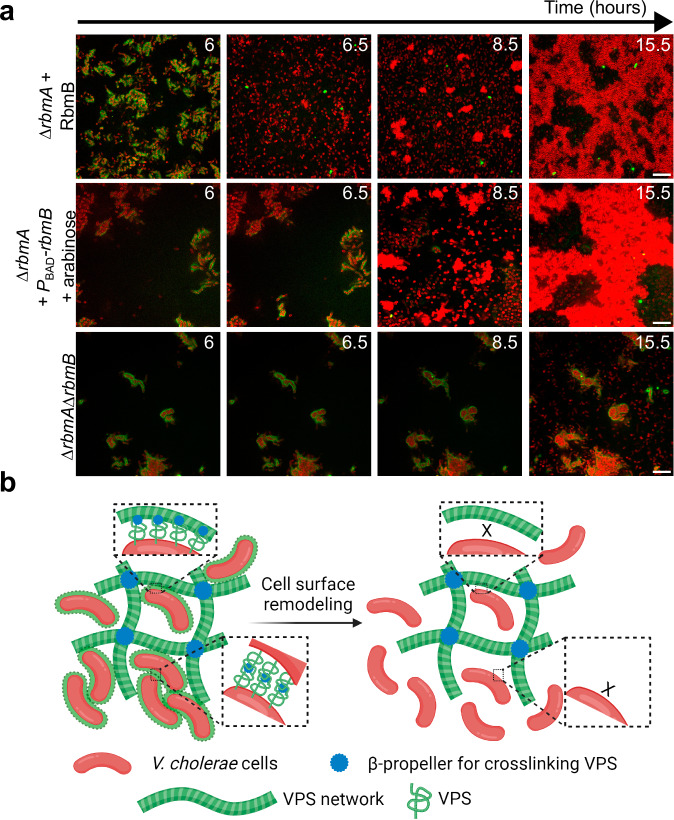
Fig. 5. Inversion of cell-matrix interaction controls biofilm disassembly.
a Cross-sectional images at z = 4 µm above the glass surface from a time course of biofilm growth of ∆rbmA (top), ∆rbmA + PBAD-rbmB (middle), and ∆rbmA∆rbmB (bottom). After 6 hours of biofilm development, RbmB (0.05 mg/mL) or arabinose (0.05 %wt) was added for the top and middle rows, respectively. Cell membranes were stained with FM 4-64 (red) and VPS was stained with WGA-Oregon Green (green). Scale bars = 10 µm. b Schematic of the interplay between Vc cells and VPS network during biofilm development, created using BioRender.com. See text for more details.

