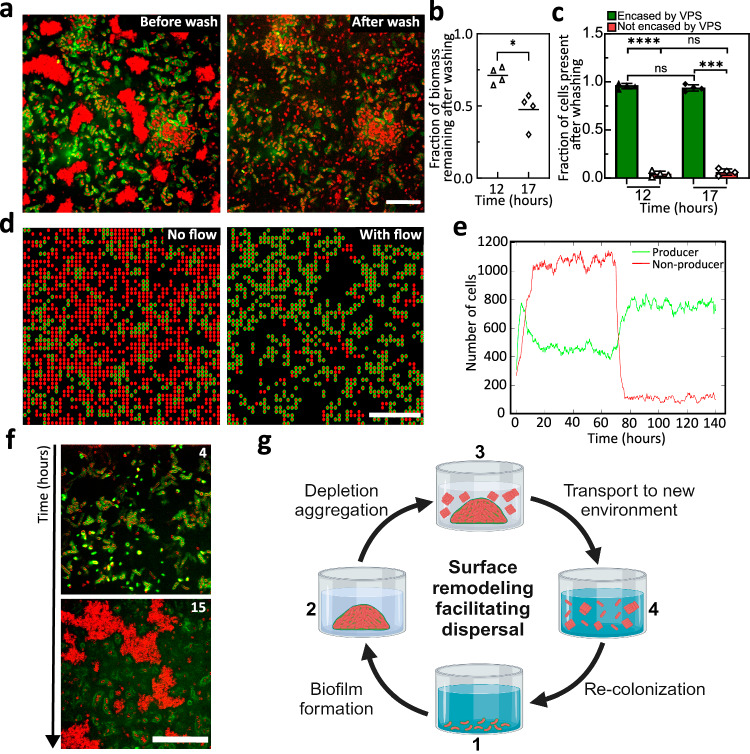
Fig. 6. Surface remodeling and aggregation facilitate dispersal.
a Cross-sectional confocal images at z = 6 µm above the glass surface before (left) and after (right) a washing step performed after 17 hours of growth for a ∆rbmA biofilm. Cell membranes were stained with FM 4-64 (red) and VPS was stained with WGA-Oregon Green (green). Scale bars = 10 µm. b Quantification of the fraction of biomass remaining after the washing step after 12 or 17 hours of growth for a ∆rbmA biofilm (n = 4 biological replicates). Statistical analysis was performed using unpaired, two-sided t-test with Welch’s correction to differentiate the fraction of biomass remaining after the wash for 12- and 17-hour-old biofilms. p = 0.0203. c Quantification of the fraction of Vc cells encased (green) or not encased (red) by VPS after the washing step for 12- and 17-hour-old biofilms, respectively. Statistical analysis was performed using an unpaired, two-sided t-test with Welch’s correction to differentiate the same cellular population between experiments at 12 and 17 hours, whereas a paired t-test was used to differentiate each cellular population at the same time point. ns stands for not significant; ***p < 0.001; ****p < 0.0001. Exact p value from left to right: <0.0001, 0.4041, 0.4041, 0.0001. Data are presented as mean values from measurements taken from distinct samples ± SD (n = 4 biological replicates). d Representative snapshots of results from a spatial stochastic model on a 2D grid including producer (P in red with green outline) and non-producer (nP in red) cells, before (left) and after (right) turning on flow. Scale bars = 10 µm. e Quantification of the number of P and nP cells before and after turning on flow (at t = 70 hours). f Representative confocal images of a ∆rbmA biofilm seeded by the depleted-aggregated cells harvested in the washing step in (a) and grown in fresh medium (at z = 6 µm above the glass surface). Cell membranes were stained with FM 4-64 (red) and VPS was stained with WGA-Oregon Green (green). Scale bar = 50 µm. g Schematic of the Vc biofilm lifecycle corresponding to the experiments in (a–f), created using BioRender.com. Source data are provided as a Source Data file.

